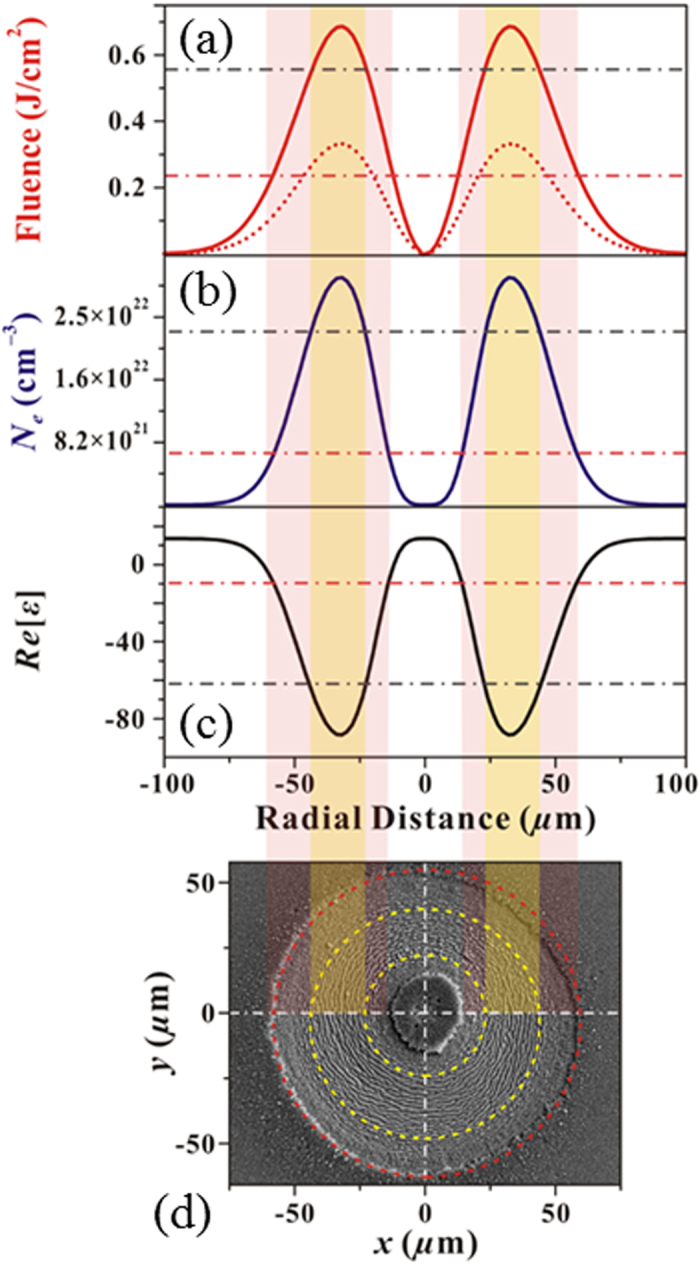
Figure 7. Dependence of the surface structures on the OV laser beam spatial intensity profile.

Panel (a) reports the OV fluence profile for E0 = 29 μJ and w0 = 46 μm (dashed curve) and the corresponding distribution of the effective fluence for N = 100 (solid curve). Panels (b,c) show the spatial profiles of the electron density Ne and real part of the dielectric permittivity Re[ε] predicted by two-temperature model and free-carrier number density equations, respectively. Panel (d) reports a SEM image of the target surface after an irradiation sequence of N = 100 laser pulses at E0 = 29 μJ. The circles and color stripes marks the distinct regions with ripples and grooves.
