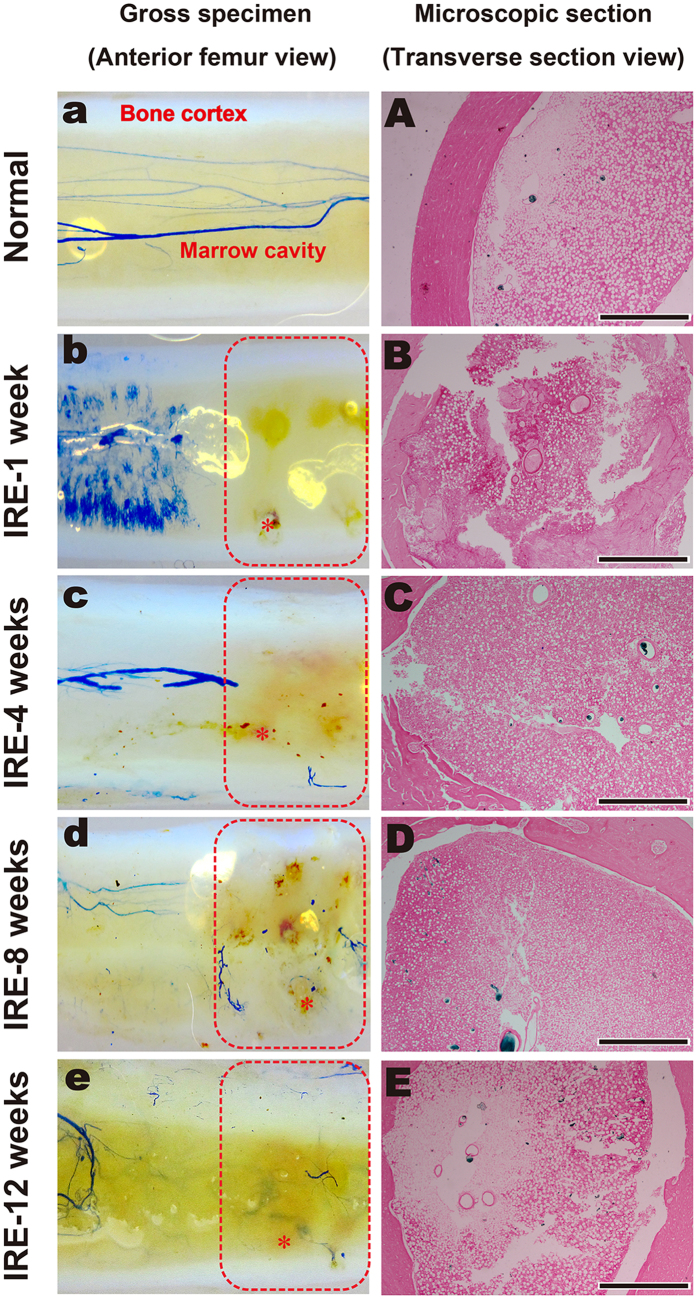
Figure 5. Angiogenic analysis by gross observation and microscopic examination.
(a–e) In the gross observation, the ablation area was surrounded by red dotted borders; one of the electric holes in an image is marked by “*”. (A–E) The microscopic section is within the ablation area. IRE-1 week: Vascular perfusion was not observed by gross observation (b). Complete occlusion of the vessel lumen occurred without blood vessel wall damage microscopically (B). IRE-4 weeks: Revascularization was scattered throughout the full ablation area (c). The blood vessel cavities were intact, although some were not filled with Microfil (C). IRE-8 weeks: The blood vessels in the ablated area gradually became coherent overall (d) and received a sufficient blood supply microscopically (D). IRE-12 weeks: The continuity of blood vessels was almost consistent with that of the normal bone group (e,E). Bars represent 500 μm.

