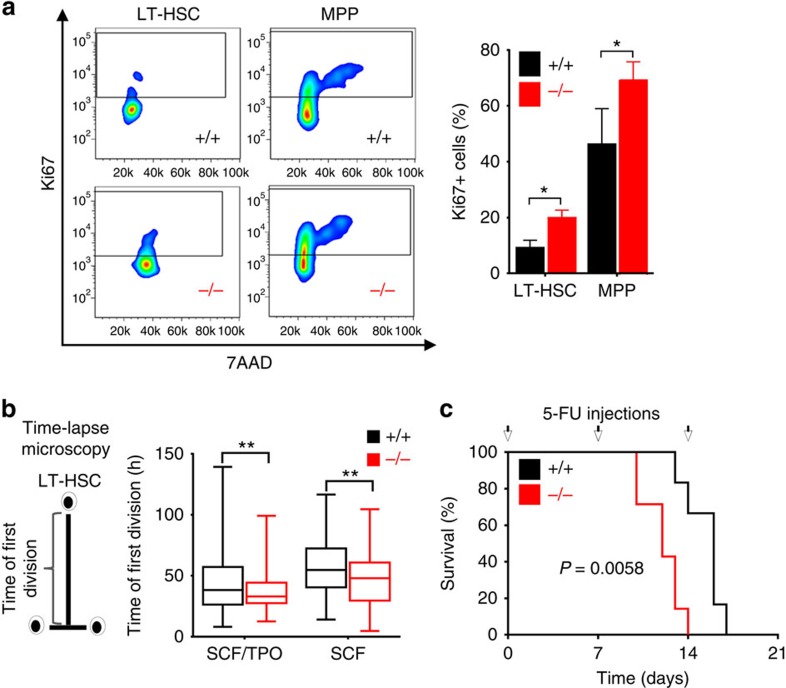
Figure 2. An increased number of miR-193b-deficient LT-HSCs are in active cell cycle.
(a) Exemplary FACS plots and quantification of Ki67 and 7-AAD (DNA content) of LT-HSCs and MPPs to assess quiescent and cycling cells. (b) Time of the first division of LT-HSCs determined by video-microscopy-based cell tracking. The box plots represent the median with whiskers min to max. (c) A Kaplan–Meier survival curve of the mice injected with 5-fluorouracil (5-FU) at the indicated time points (arrows). N=7 miR-193b−/− mice, N=6 miR-193b+/+ mice. Gehan–Breslow–Wilcoxon test. All data are represented as the mean±s.d. *P<0.05; **P<0.01.

