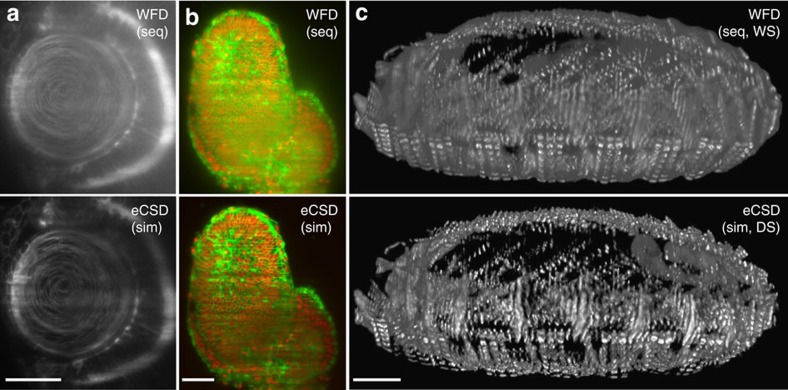
Figure 4. eCSD multiview light-sheet images with direct data fusion.
(a–c) Examples of contrast enhancement with sequential or simultaneous illumination, direct or weighted sum by confocal versus widefield detection for different organisms and biological markers: (a) Zebrafish eye lens region, (Cry::CFP), (b) 6.5 dpf mouse embryo (R26-H2B-mCherry x mG), (c) 3D projections of muscle related Kettin-mCherry labeled Drosophila (14 h AEL). Scale bars for all subpanels are: 30 μm in (a) and 50μm in (b,c) and the electronic slit size was fixed to 1.5 times the beam-slit size for all eCSD images. Note that this corresponds to a slit size of 30–60 pixels on the camera sensor depending on the illumination and detection optical setup for each experiment. The illumination beam diameter was measured before the imaging to obtain the beam-slit size of the optical setup.

