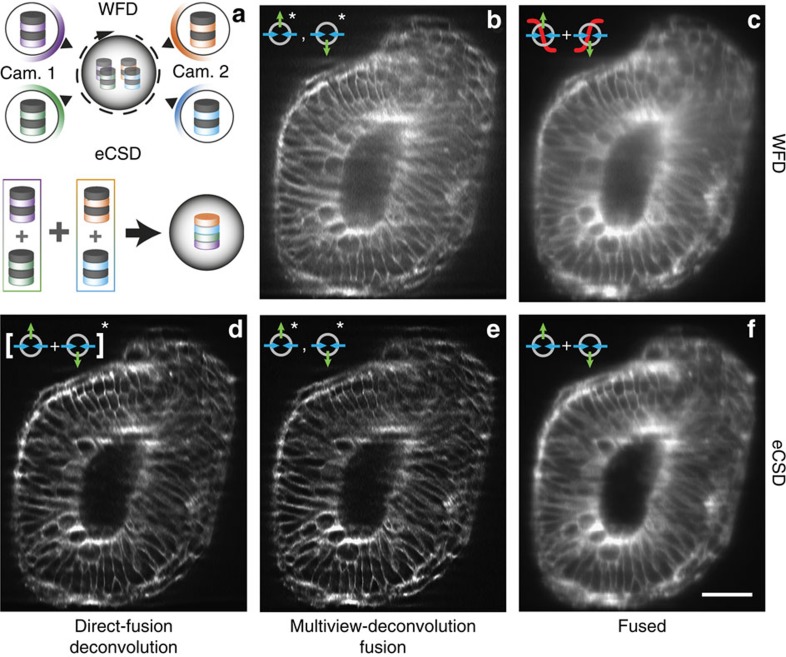
Figure 5. Comparison of multiview-deconvolution fusion and eCSD facilitated direct fusion.
(a) Illustration of multiview-deconvolution fusion pipeline (top) and optimized direct-fusion deconvolution data processing for eCSD data sets. In multiview-deconvolution fusion all views (in our case 4) enter the deconvolution pipeline and are iteratively combined to a single high quality data set. In contrast the eCSD pipeline first fuses the four views to a single data set, which is then deconvolved by a classical (single view) deconvolution scheme. (b) Widefield multiview-deconvolution fused data set. (c) Sigmoidal-fused widefield data sets without deconvolution post-processing. (d) Direct-fused eCSD data sets followed by single view deconvolution. (e) Multiview-deconvolution fusion of eCSD data sets. (f) Direct-fused eCSD data sets without deconvolution post-processing. All subpanels display a cross section YZ-plane around 81 μm deep from the anterior side of the membrane data (mouse embryo) presented in Fig. 4b. The Fiji multiview-deconvolution plugin was used for data set shown in (b,d,e). Please note that for the direct-fused data set in (d) the Fiji plugin was used as a single view deconvolution algorithm. Supplementary Fig. 8 shows a comparison of Fiji plugin results of (d) with a commercial single view software package. Scale bar is 50 μm.

