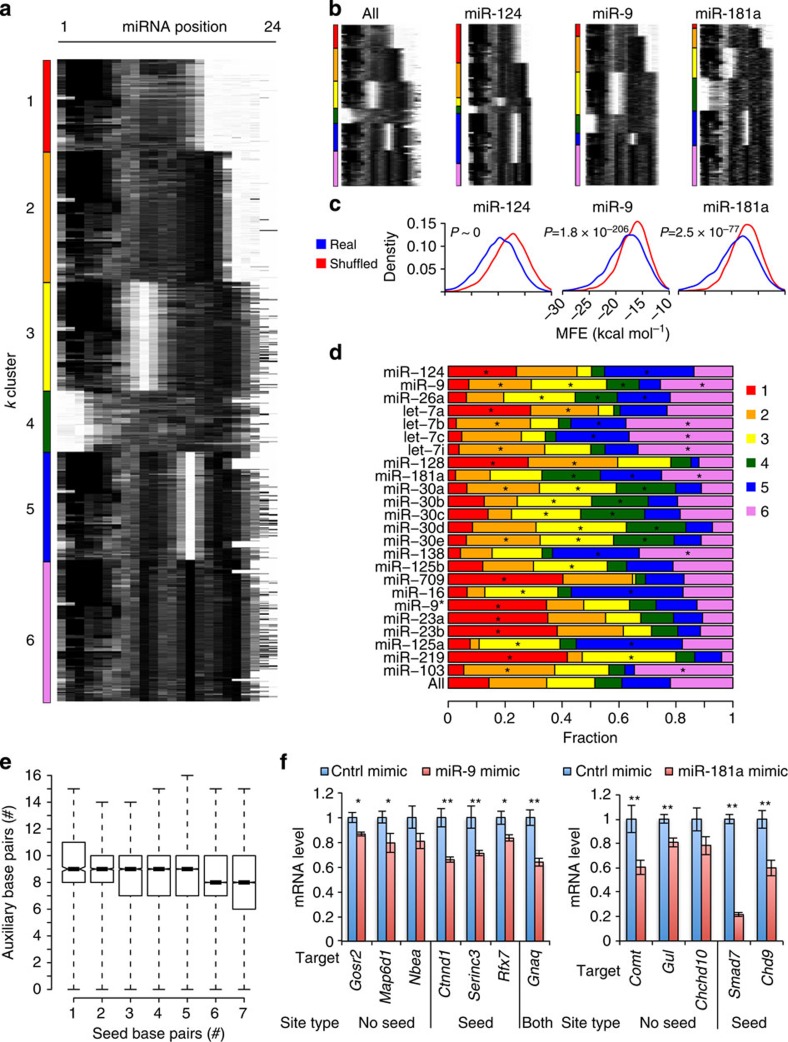
Figure 4. Duplex structure prediction reveals diverse targeting patterns for brain miRNAs.
(a) RNAhybrid miRNA–target duplex structure predictions represented as heat maps40. Black pixels indicate base pairing and white pixels indicate gaps. Structures were partitioned by k-means clustering into six groups (see Methods). Interactions from all transcript regions were included in this analysis. (b) Structure maps for individual miRNAs compared with all. (c) Density plots of duplex minimum free energies (MFEs) are shown for the indicated miRNA–target interactions (blue) or shuffled interactions (red), where each chimeric target region was randomly re-assigned to an miRNA from a different chimeric interaction. MFEs were calculated with RNAhybrid. Axis labels are printed once, but apply to all plots. P-values from two-tailed t-tests are shown. (d) Distributions of the six identified k-clusters for the top brain miRNAs, ranked by decreasing abundance from the top to the bottom. Most brain miRNAs (∼90%) and all shown here have significant preferences versus the whole population (*positive enrichment, P<10−3, Fisher's exact test; full set is in Supplementary Table 3). (e) Box plot comparing number of predicted seed region base pairs with predicted auxiliary base pairs for all brain miRNA–target chimeras. (f) Experimental validation of chimera-identified seed-dependent and seedless (k=4, with no canonical seeds in 3′-UTR) miR-9 and miR-181a targets was performed by transfecting miRNA mimics into N2A cells and measuring endogenous targets by qRT–PCR. The average fold change in miRNA mimic versus control mimic-transfected cells is shown from four independent transfections, ±s.e.m. *P<0.05 and **P<0.01, one-tailed t-test. Smad7, a previously confirmed miR-181a target, served as a positive control68.

