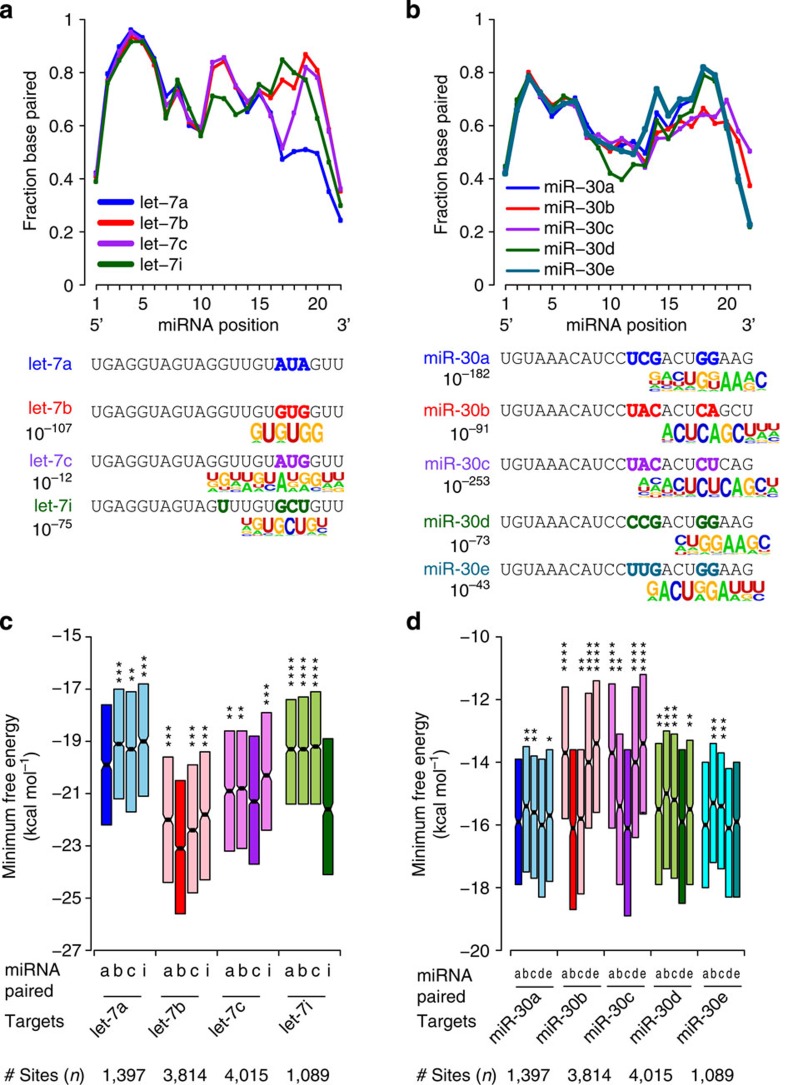
Figure 7. CLEAR-CLIP reveals target specificity among miRNA family members.
Base pairing profiles from duplex structure maps for let-7 (a) and miR-30 (b) family members are shown. For each miRNA, the fraction of interactions with base pairing at each miRNA position is plotted. miRNA sequences are shown below with coloured bases indicating divergent nucleotides. De novo motif analysis of target regions for indicated miRNAs revealed family-member-specific motifs complementary to divergent parts of the miRNAs. For easier interpretation, the target motifs were reverse complemented to match the miRNA sequences. P-values for enrichment over background (AGO-binding regions in brain) from HOMER are indicated. No unique auxiliary motif was found for let-7a, the only such case. (c,d) Predicted minimum free energies (MFEs) from pairwise analysis of duplex structures for chimera-defined targets and the indicated let-7 (c) or miR-30 (d) family members is shown. Targets paired with their chimera-identified, cognate let-7 family member are shaded darker. Interactions from all transcript regions were included in these analyses. Box plots depict interquartile (25–75) values (*P<0.05, **P<0.001, ***P<10−10 and ****P<10−50, one-tailed t-test).

