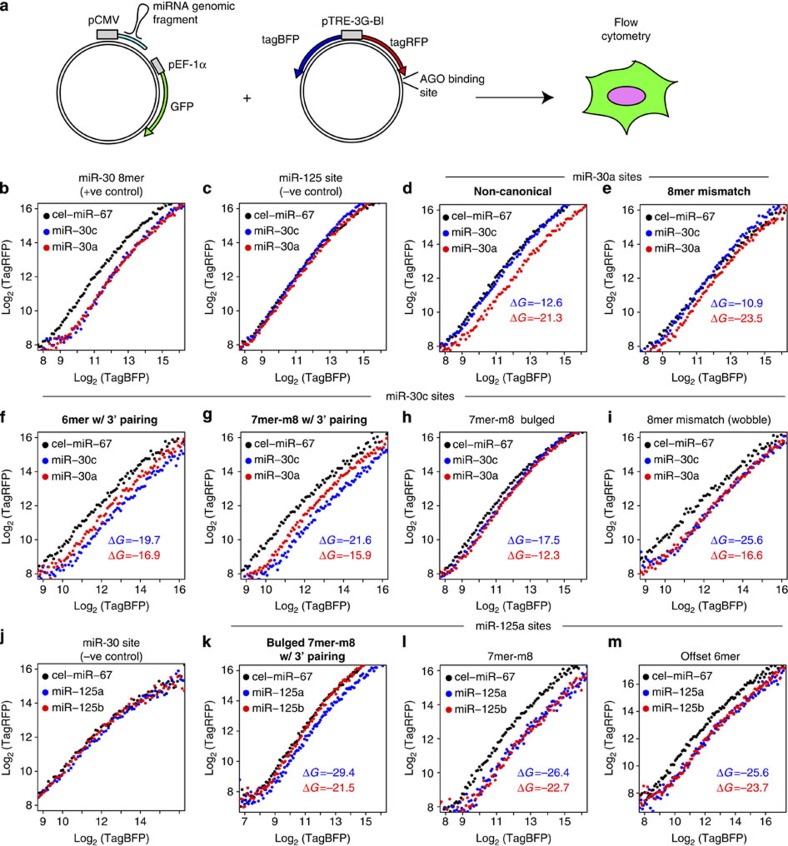
Figure 8. miRNA family member specificity confirmed by single cell measurements.
(a) A system for single cell measurements of miRNA-mediated repression, adapted from ref. 46. tagRFP and tagBFP are expressed from the doxycycline-inducible bidirectional pTRE-3G-BI promoter. CLEAR-CLIP-defined AGO-binding sites were cloned into the 3′-UTR of the tagRFP cassette, with tagBFP used for internal normalization. Plasmids co-expressing miRNAs and GFP were co-transfected and measurements were taken 48 h later. (b–m) Log-transformed plots of tagRFP versus tagBFP fluorescence, with minimum free energies (MFEs) (ΔG) for predicted base pairing between duplex structures for indicated paralogues. A description of the site type is shown above each plot, with bold labelling denoting successful validation of paralogue specificity. Evaluation of miR-30a (red), miR-30c (blue) and negative control miRNA (black) overexpression on (b) a full miR-30 8mer site as a positive control for miR-30 paralogues; (c) a miR-125 site as a negative control for miR-30 paralogues; (d,e) sites with predicted miR-30a preference; and (f–i) sites with predicted miR-30c preference. Evaluation of miR-125a (blue), miR-125b (red) and negative control miRNA (black) overexpression on (j) a miR-30 site as a negative control for miR-125 paralogs and (k–m) sites with predicted miR-125a preference. Representative plots from at least two independent experiments for each construct are shown.

