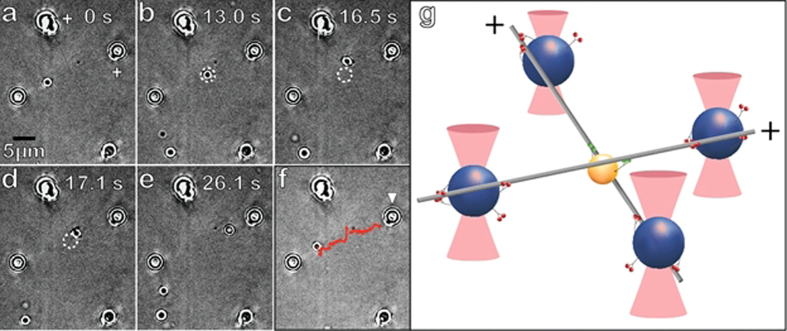
Figure 4. Technique validation for motility assays.
(a) A MT crossing with 500 nm vertical filament separation is shown. An MC starts out progressing towards the intersection on the overlying MT. (b) MC reaches intersection and a tug of war ensues. The MC which is engaged on both MTs, starts to migrate up the transverse MT (c), but then after 0.6 seconds, disengages the transverse MT and snaps back (d) to once again solely translocate along the original MT (e). (f) Trace of the MC’s progression (red) overlaid on the original frame of the sequence shown in (a). This event is representative for assays with MC-MT binding fraction slightly below saturation. White arrow in (f) indicates the BH whose position is tracked (Supplement Fig. 6). (g) Graphical model (not to scale) depicting the key aspects of the set-up in (a–f) and tug of war scenario in frame (c).

