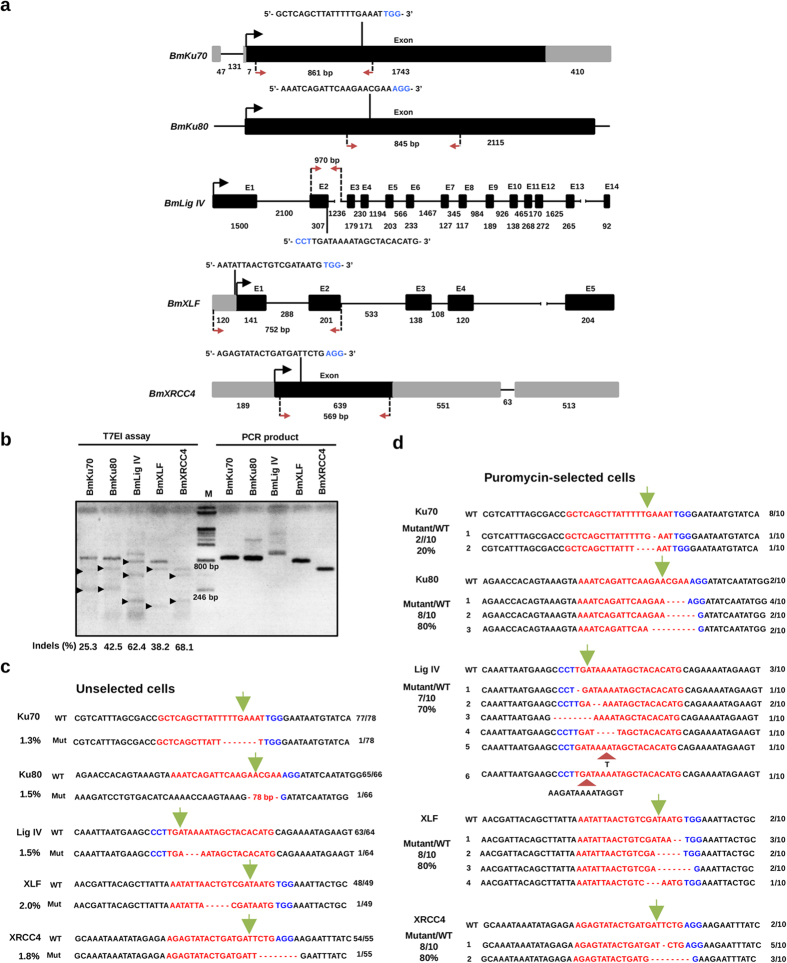
Figure 3. CRISPR/Cas9-mediated NHEJ-related gene mutations in silkworm cells.
(a) Design of gRNAs targeting to NHEJ-related genes. Designed gRNAs were marked on the top of the gene structures. Nucleic acids marked by blue were Proto-spacer Adjacent Motifs (PAM). Gray boxes and black boxes represent untranslated regions and depicting exons, respectively. Black lines between exons represent introns. Black arrows indicate the starting point for translation. Red arrows indicate the targeted regions, which were cloned for sequence analysis. (b) T7EI assay was performed to detect the mutants. Black arrows indicate the predicted sizes of T7EI digestion. PCR products amplified form the target regions were used as negative controls. Primers used for the PCR reactions are listed in Table S5, and the percentage of cleaved band was measured using Image J software. The result was representative of three independent experiments. Numbers below the bands indicate average percentage of Indels (n = 3). (c) Sequences of gRNA target sites in the puromycin-unselected cells. BmN4-SID1 cells was transiently transfected with the All-In-One vectors. One week later, the cells were used for genome extraction, with which the target regions were amplified and cloned for sequence analysis. Red color marked nucleic acids indicate gRNA target sequences, while the blue ones indicate PAMs. Deletions were modified by dashed lines. Green arrows pointed to the sites cut by Cas9 protein. The fractions listed on the right indicate the numbers of mutations or wild type in the total sequenced clones. The numbers of percentage on the left indicate the mutation rates in the sequenced colonies. (d) Sequences of gRNA target sites in the puromycin-selected cells. Signs were used as the same as in C. Besides, insertions were marked with red arrowheads.

