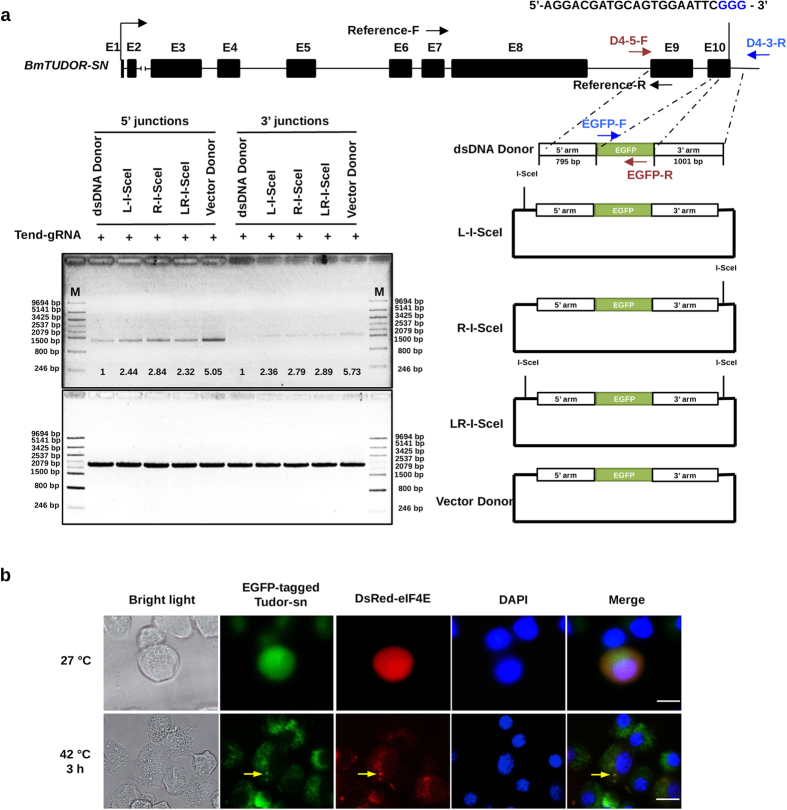
Figure 5. Epitope tagging of the BmTUDOR-SN gene.
(a) Schematic overview depicting the exon 10 knockin strategy using different types of donors (dsDNA donor, cycle plasmid with an I-SceI site on the flanking of left homologous arm, cycle plasmid with an I-SceI site on the flanking of right homologous arm, cycle plasmid with two I-SceI sites on the flanking of left and right homologous arms both, vector donor) and genomic DNA PCR analysis. Exons were indicated by black boxes, and target for gRNA of BmTUDOR-SN gene are indicated by a short straight line. The primers for 5′ junction (D4-5-F, EGFP-R), 3′ junction (EGFP-F, D4-3-R), and reference (Reference-F, Reference-R) amplification were marked by red, blue, and black arrows, respectively. Primer sequences were listed in Table S5. Genomic DNA PCR was performed at 7 days post transfection of the donors as indicated. The PCR products were diluted by a 2 fold serial dilution to be used for quantification of gel images with Image J software. Correct integration was calculated as fold shown in the upper gel by comparison with PCR products (dsDNA donor was set as 1 fold), with normalization to the corresponding reference PCR bands. The agarose gel images were representatives from repeated three independent experiments. The numbers below the PCR bands represent mean fold from the three repeats. (b) Images of knock-in cells under normal culture condition and stress condition. The knock-in BmN4 cells were enriched by a series of limiting dilutions after transfection with CRISPR/Cas9 system, plasmid donors. The enriched cells were transfected with DsRed-eIF4E expression vector19 and suffered from heat shock for 3h at 42 °C 3 days after transfection. The cells were visualized by a fluorescent microscope. Scale bar, 20 μl.

