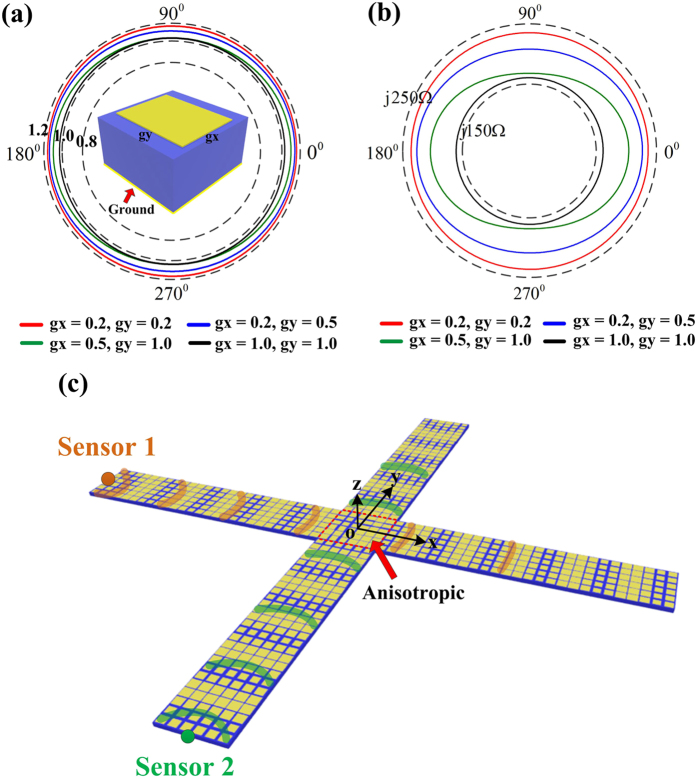
Figure 1.
(a) The structure of the surface impedance which can realize both isotropic and anisotropic unit cells. We plot the curves of the surface refractive index at 17 GHz by choosing four different textures from our unit database. In the unit database, both  and
and  vary from 0.2 to 1.0 mm. (b) The relevant curves of the surface impedance. (c) The cross-type metasurface for dual-sensor imaging. The anisotropic unit cells are placed in the center and isotropic units are placed on the four arms of the metasurface.

