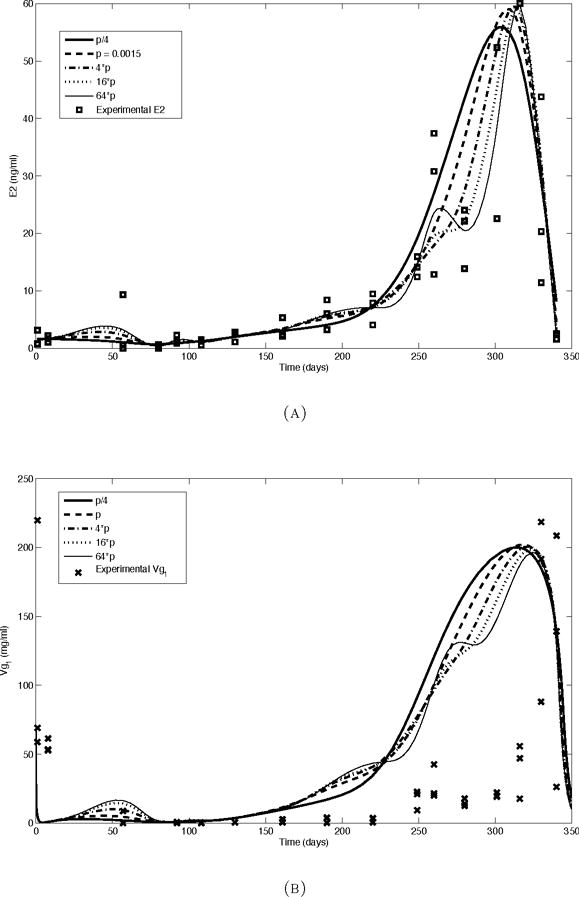
FIGURE 2.2.

The effect of varying the amount of smoothing on the model input and simulation results in trout reared under a normal photoperiod cycle. The numbers in the figure legends represent different values of the smoothing parameter used by the MATLAB function csaps (larger numbers correspond to less smoothing, but better interpolation). (a) The experimentally observed concentration of E2 in plasma and smoothed model input, (b) The observed concentration of Vg in plasma (Vg1) and simulation results.
