
FIGURE 3.2.
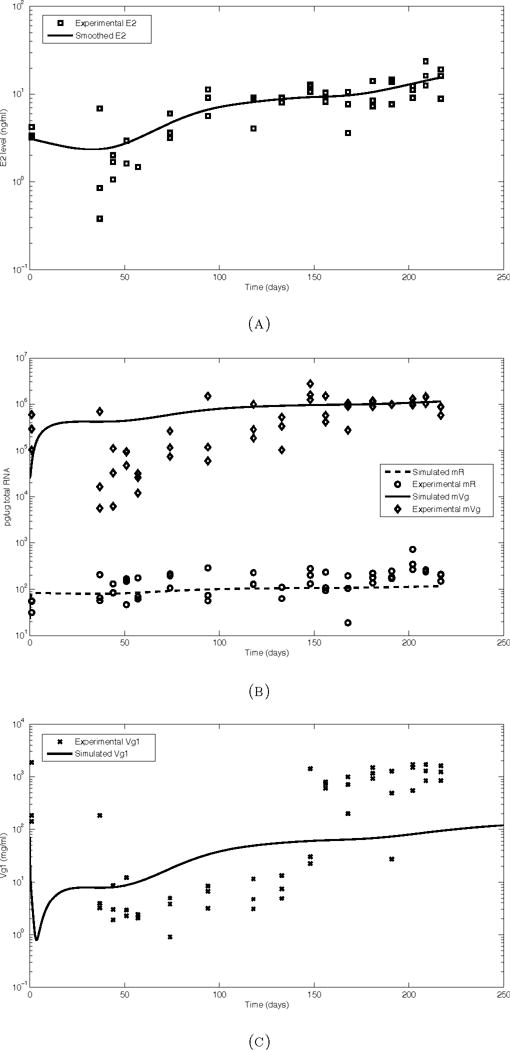
Model simulations (solid lines) and observed data from trout reared under a compressed photoperiod cycle. All simulations were performed using the smoothing parameter 4·p for the E2 input. (a) E2, (b) mR and mVg, (c) Vg1. Note use of logarithmic scale on Y-axis.