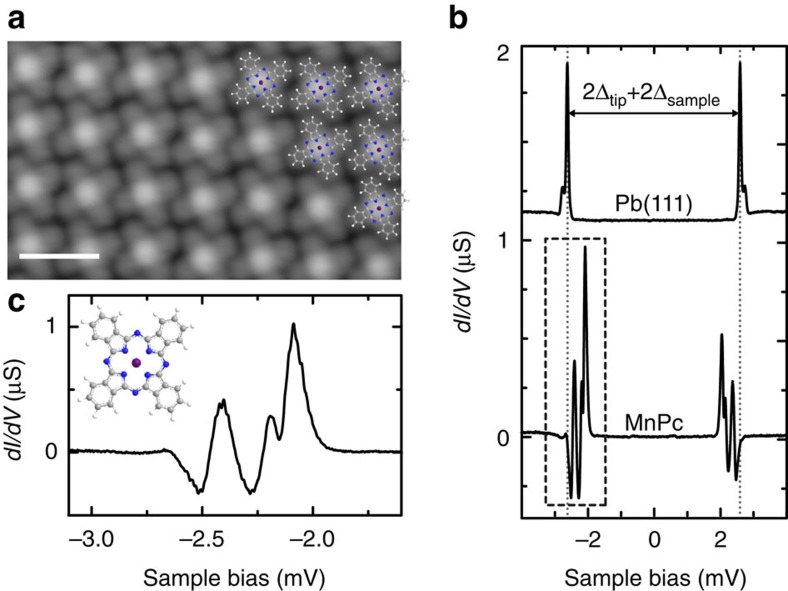
Figure 1. MnPc adsorption and magnetic fingerprint on Pb(111).
(a) STM topography of a MnPc monolayer island on Pb(111), partially overlaid with ball-and-stick structure models of MnPc (V=50 mV, I=200 pA); scale bar is 2 nm. (b) dI/dV spectra on the pristine Pb(111) surface (offset for clarity) and on the centre of an MnPc molecule inside a molecular island. Grey dotted lines indicate the energy of the BCS quasiparticle resonances (opening feedback loop at: V=5 mV, I=200 pA). (c) Magnified view on the subgap excitations below EF in the dashed box of the MnPc spectrum in b. The inset shows an enlarged MnPc structure model.

