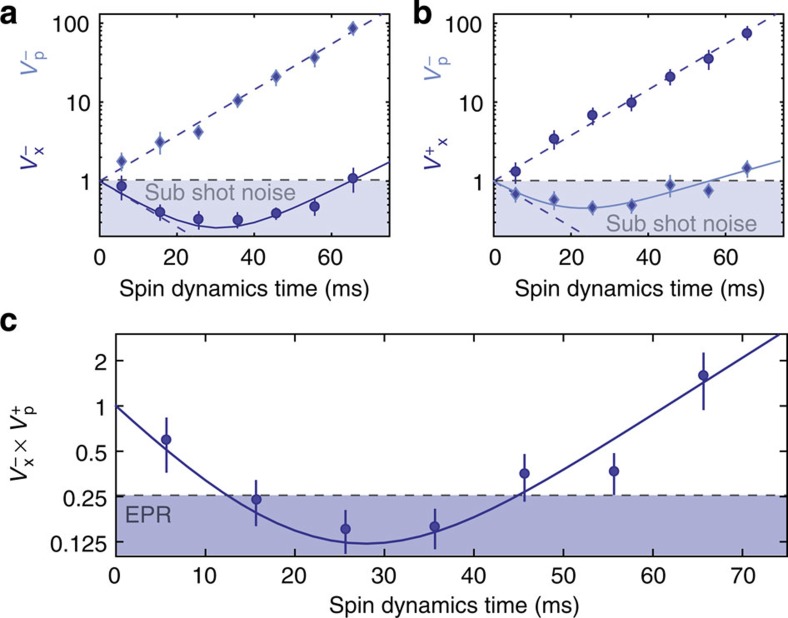
Figure 3. Squeezing dynamics.
(a,b) Time evolution of the four two-mode quadrature variances  ,
,  during spin dynamics. The data follow the ideal squeezing/anti-squeezing behaviour according to the independently measured spin dynamics rate (dashed line). (c) Time evolution of the EPR parameter
  during spin dynamics. The squeezed variances and the EPR parameter are well reproduced by a simple noise model (solid line). The error bars indicate the statistical uncertainty (one s.d.).

