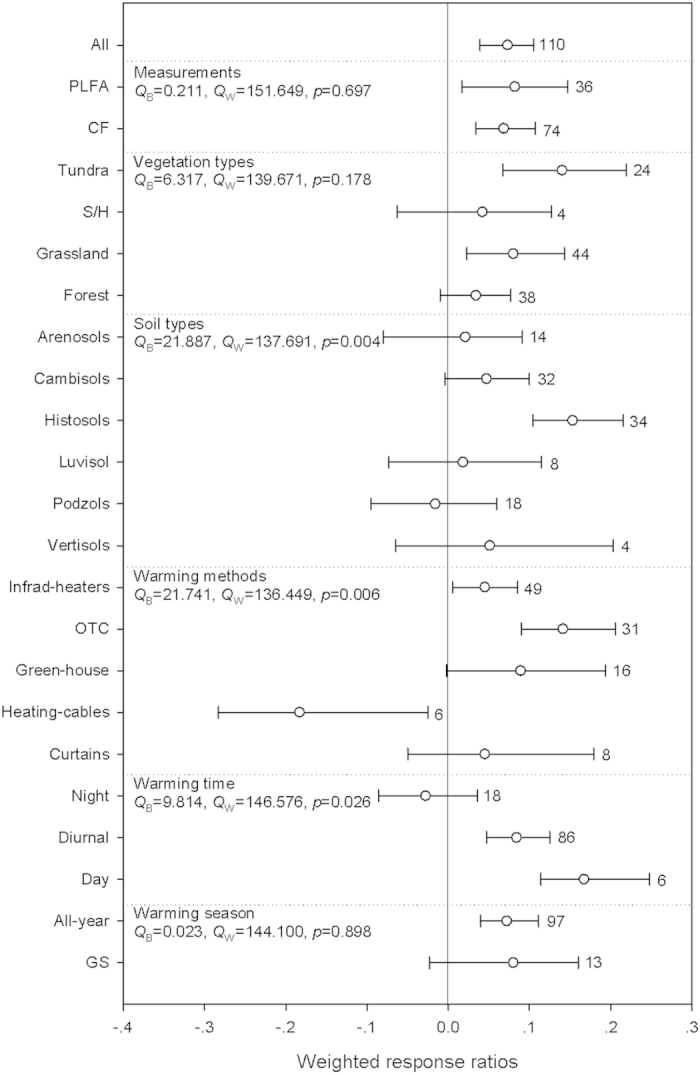
Figure 1. Warming effects on microbial abundance.

Error bars represented bootstrap 95% confidence intervals (CIs). The effect of warming was considered significant if the CI of the effect size did not cover zero. The sample size for each variable was shown next to the CI. The definition of QB and Qw can be found in materials and methods section, the p values indicate the difference within groups (Qw). The vertical solid line was drawn at mean effect size = 0. CF: chloroform fumigation, S/H: shrubland/heathland, GS: growing season, NGS: non-growing season. More information about the the percentage change for each variable and the weighted responses ratios in different warming magnitude for each variable can be found in supplemetary Table 1.
