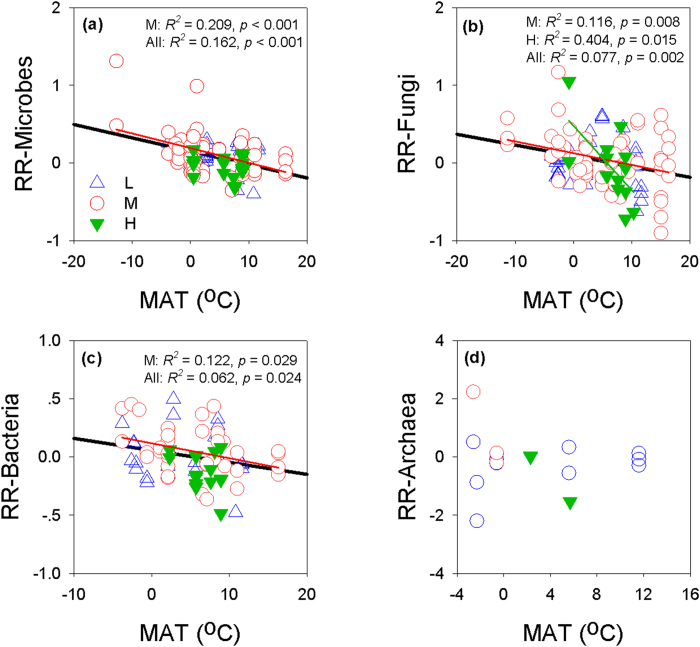
Figure 5. Relationships between the response ratios (RR) of the abundance of microbes (a), fungi (b), bacteria (c), and Archaea (d) and mean annual temperature (MAT).
L: low warming magnitude; M: medium warming magnitude; H: high warming magnitude; the black solid line show the overall relationship between the MAT and RR of microbial abundances to warming.

