Figure 8.

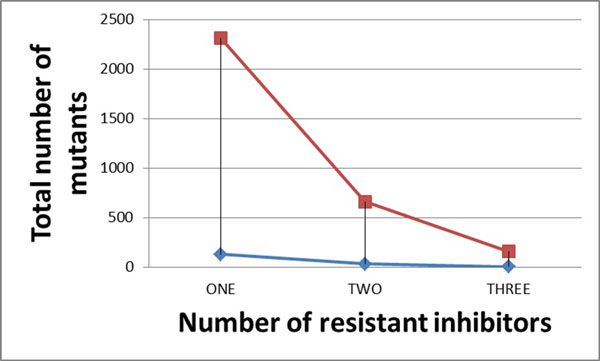
The relation between total number of mutants and number of resistant inhibitors for NNRTIs. The red line shows the result for the original data in bin X; while the blue line shows the result for selected mutants in bin X.

The relation between total number of mutants and number of resistant inhibitors for NNRTIs. The red line shows the result for the original data in bin X; while the blue line shows the result for selected mutants in bin X.