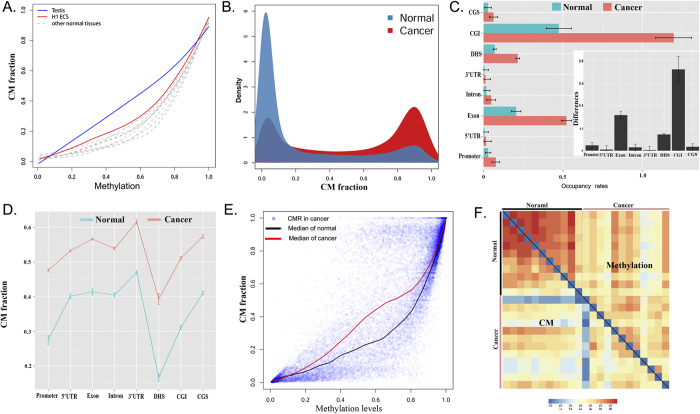
Figure 3. Characteristics of CM.
(A) The relationship of CM fractions and average methylation levels in normal tissues is shown in Table 1. The maximum CM and CM of random methylation trends were computed using simulated data of concordant and random methylation pattern (methylation levels from 0.1 to 0.9), respectively. (B) Probability density distribution of average CM fraction from cancer and normal tissues, respectively. (C) Occupancy rates of CMRs in promoter, 5′-UTR, exon, intron, 3′-UTR, DHS, CGI and CGS. Box figure represents the degree of difference in occupancy rate between cancer and normal cells in each region. Notably, the occupancy rate of CGI in cancer was more than 1 because the length of some CMRs in CGI was longer than the CGI. (D) Average values of CM fraction of cancer and normal cells in promoter, 5′-UTR, exon, intron, 3′-UTR, DHS, CGI and CGS. (E) The relationship between CM fractions and average methylation levels in normal and cancer cells, respectively. (F) Heat map of correlation of CM fraction or average methylation levels among tissues.

