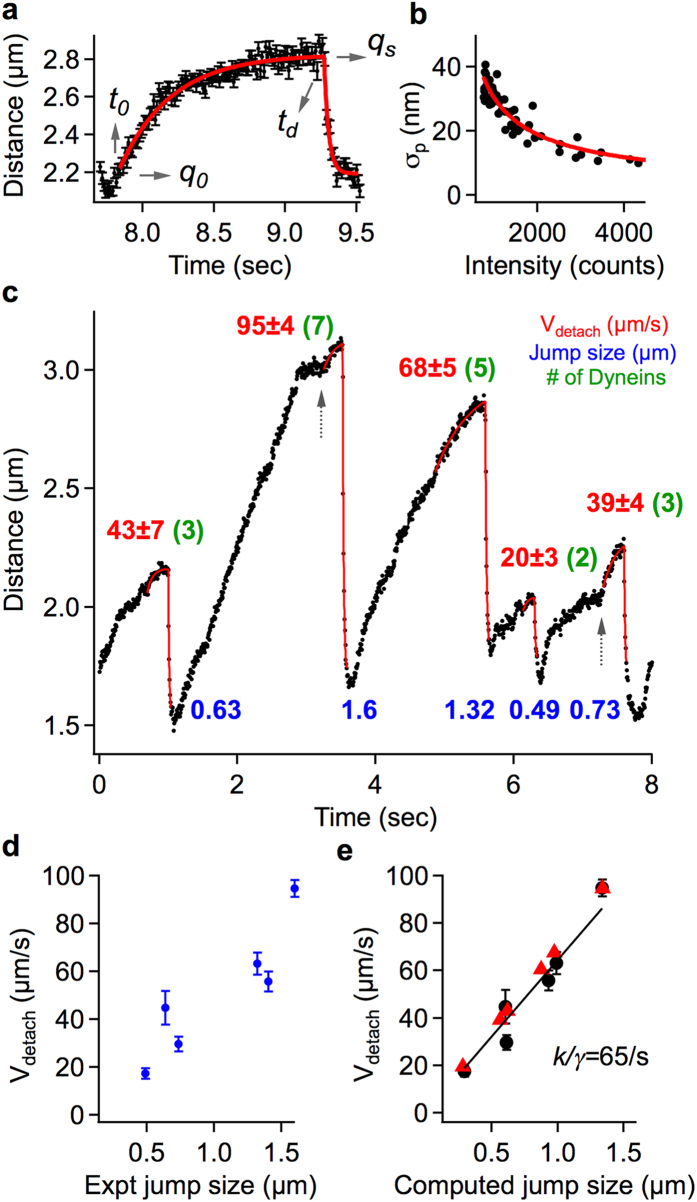
Figure 3. Detachment velocities from fitting the endosome jumps.
(a) Global fitting (red) of pre- and post-detachment curves to estimate the detachment time and position (qs, td), detachment velocity Vdetach, and damping constant k/γ, from an endosome jump. (b) Power law calibration (red) of position uncertainties (black, standard deviation over 10s of tracking of coverslip bound INPs as a function of fluorescence intensity) used in model fitting. (c) Retrograde INP100-endosome trajectory exhibiting a range of jump sizes and multiple-dynein stall profiles (dotted arrows) at 45 W/cm2, 150fps. Experimental jump sizes (near multiples of 0.23 μm) are labeled in blue and the detachment velocities Vdetach (near multiples of 13 μm/s) are labeled in red. (d) Approximate linearity of Vdetach with experimental jump size. e) Vdetach obtained with k/γ as a fitting parameter (black) or fixed at 65/s (red) plotted vs the computed jump size.

