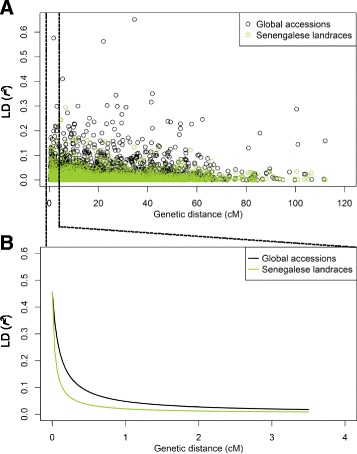
Fig. 7.

Linkage disequilibrium (LD) decay with respect to genetic distance. a Pairwise LD against genetic distance on all linkage groups for global accessions and Senegalese landraces. b LD against the genetic distance between 0 ~ 3.5 cM. The lines were plotted using non-linear model to fit the LD decay against the genetic distance
