
Figure 2.
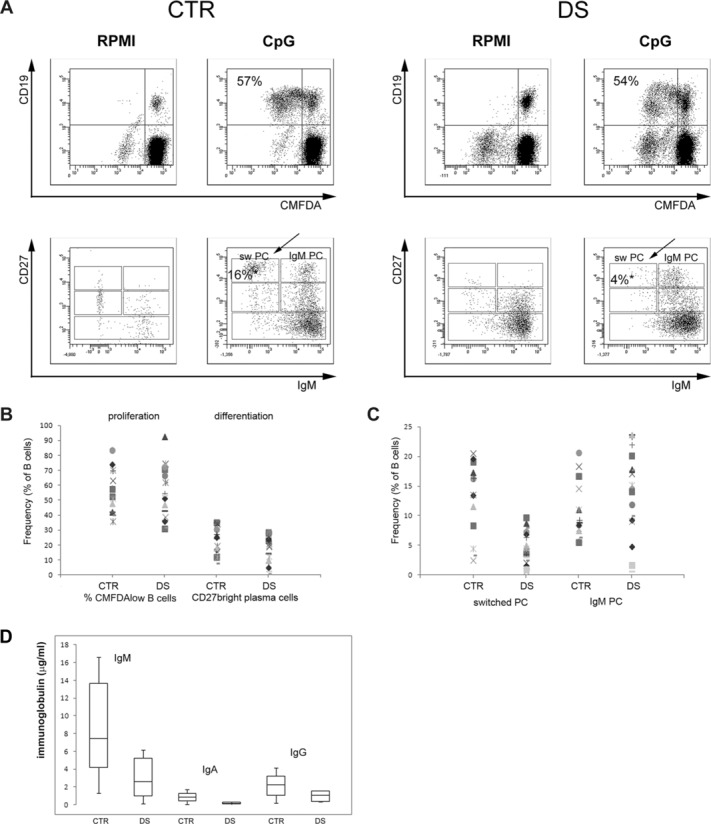
In vitro proliferation and differentiation of B-cell populations. (A) PBMCs isolated from CTR and DS children were cultured for 7 days without (RPMI) or with CpG (CpG). Proliferation was measured by the loss of CMFDA fluorescence in daughter cells and expressed as percentage of proliferating (CMFDAlow) CD19+ B cells by cytofluorimetry (top). Plasma cells of IgM and switched isotype were identified by cytofluorimetric analysis, CD27 versus IgM staining of cells of CD19+ cells is shown (bottom). CD27+++ IgM− B cells are switched plasma cells (sw PC, indicated by the arrow). The plot shows one representative example of the analysis performed on all 19 DS and 19 CTR children. (B) Frequency of proliferating B cells for each of the 19 CTR and 19 DS children. Differentiation is expressed as frequency of total CD27+++ CD38+++ plasma cells obtained in culture. Proliferation was measured as indicated in (A). (C) Frequency of switched and IgM plasma cells detected in culture for each CTR and DS child measured as indicated in (A). (D) The concentration of IgM, IgG, and IgA was measured in the supernatants of CpG-stimulated cultures collected at day 7. Data are shown as median + IQR of 19 DS and 19 CTR children. (B–D) Statistical significance was calculated by the Mann–Whitney U-test.