
Figure 4.
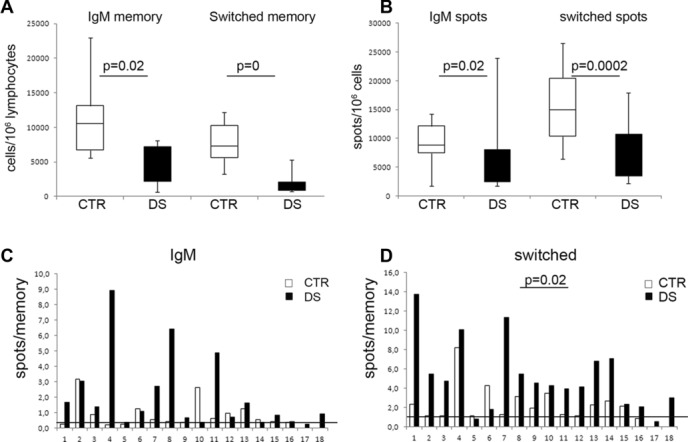
Increased differentiation potential of switched memory B cells of DS children. (A) Number of IgM and switched memory B cells seeded at day 0 for CTR (white columns) and DS (black columns) children contained in 106 PBMCs. PBMCs of DS children contain significantly less memory B cells. The numbers were calculated based on the flow cytometric analysis performed on day 0. (B) Number of spots obtained at day 5 from 106 cells of CTR (white columns) and DS (black) children, secreting either IgM or IgG as determined by ELISPOT using isotype-specific antibodies. Fewer antibody-producing cells are generated in DS children. (C) Ratio between the number of IgM spots obtained at day 5 and of IgM memory B cells seeded at day 0 (CTR, white; DS, black). Cells numbers were determined as in A and the number of IgM-secreting cells was calculated by ELISPOT. The line indicates the median value of the ratio calculated in CTR. Eleven of the 18 patients with DS have a higher ratio than the median of CTR. Statistical significance was calculated by the Mann–Whitney U-test. The difference between the two groups is not significant. (D) Ratio between the number of switched (IgG + IgA) spots and of switched memory B cells plated at day 0 (cell numbers were calculated as described in A). The line shows the median value of the ratio in CTR. A total of 16/18 DS patients have a higher ratio than the median of CTR. Statistical significance was calculated by the Mann–Whitney U-test. The difference between the two groups is significant.