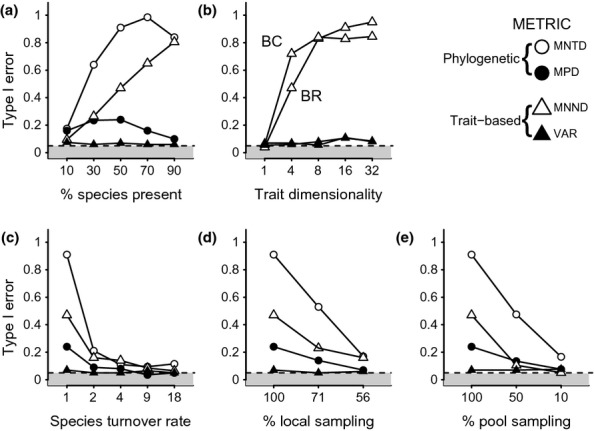
Figure 4.

Type-1 error rates under the random-draw null model for different metrics (symbols). Type-1 error depends on (a) the % of species locally present, (b) trait conservatism (BR = Brownian Random, BC = Brownian Conserved) and dimensionality (c) rates of community turnover (shown as rate of local extinction relative to speciation), (d) the % of species in the local community that have been sampled and (e) the % of the species pool included in the phylogenetic tree. Plots (a, c, d, e) show results under a BR model of trait evolution for 4 trait dimensions. See Methods for details of metrics and Table S2 for parameter values used in simulations. Dashed black line and grey box shows acceptable Type 1 error rates (i.e. < 5%).
