
Figure 5.
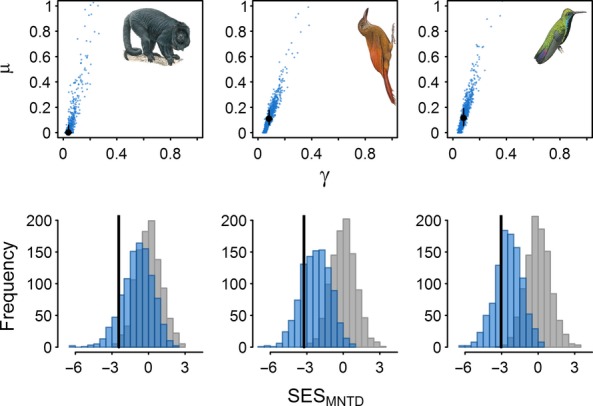
The dynamics and phylogenetic structure of community assembly for New World primates (left), ovenbirds (middle) and hummingbirds (right) in Manu. Maximum likelihood rate estimates (black points) of colonisation (γ) and local extinction (μ) with uncertainty in estimates (black lines 75% CI) quantified from 1000 bootstrap replicates (blue points). Community phylogenetic structure according to the Mean Nearest Taxon Distance (SESMNTD) showing the observed patterns (black lines), the expectation under the random-draw null model (grey) and the expectation under DAMOCLES given estimated rates (from 1000 replicate simulations).