
Fig. 3.
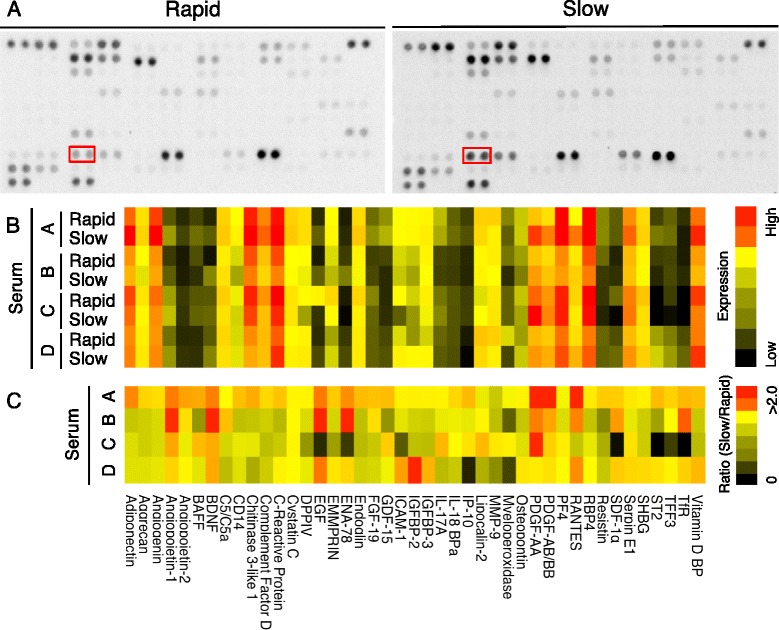
Cytokine expressions in rapid and slow preparation serum. a Representative images of cytokine arrays. Each antibody is spotted in duplicate on a nitrocellulose membrane. Spots for PDGF-AA are surrounded with red squares. b Heat map for cytokine expression level in rapid and slow preparation sera in four donors. c Heat map for ratio of cytokine expression level in slow preparation serum to cytokine expression level in rapid preparation serum. See Table 1 for a list of proteins