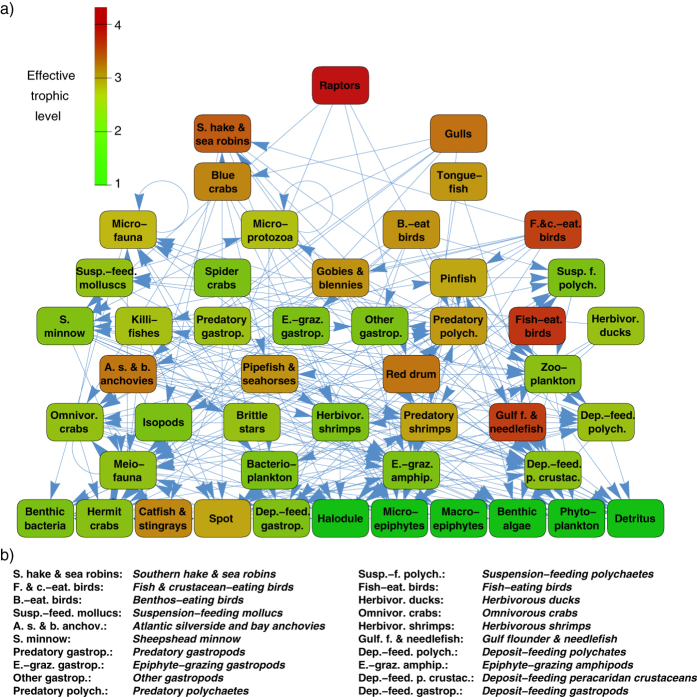
Figure 4. Hierarchy of the St. Marks food web.
(a) The nodes are ordered according to the stationary distribution of the random walkers calculated from (9), and the hierarchy levels are corresponding to groups of nodes for which the standard deviation of  is at most 0.125 ⋅ σ(pstat), where σ(pstat) denotes the standard deviation of
  over the whole network. The colour coding of the nodes reflects their effective trophic level published in36. (b) Listing of the abbreviations used in (a).

