Figure 6. The z-score of H for the networks shown in.

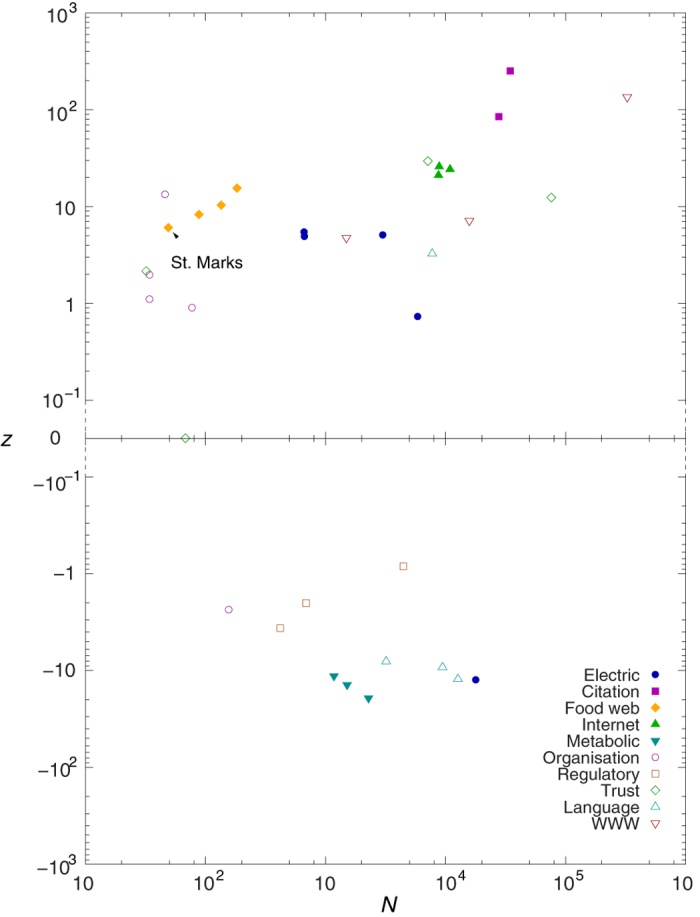
Fig. 5. The z-score, given by z = (H − 〈H〉)/σ(H) is plotted as a function of the system size N. The random null-model for evaluating 〈H〉 and σ(H) is corresponding to the configuration model.

Fig. 5. The z-score, given by z = (H − 〈H〉)/σ(H) is plotted as a function of the system size N. The random null-model for evaluating 〈H〉 and σ(H) is corresponding to the configuration model.