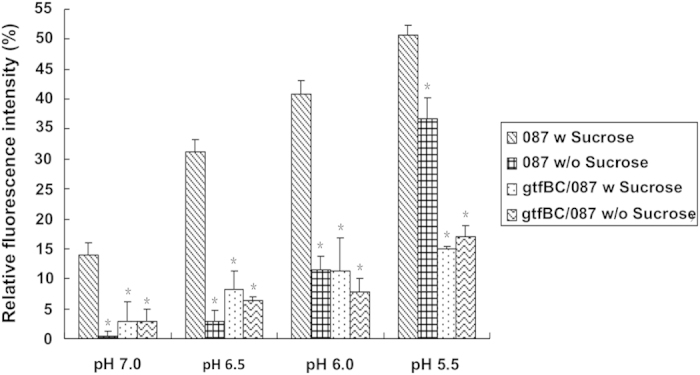
Figure 1. Percentage changes of fluorescence intensity in S. mutans wild-type and gtfBC-deficient strains upon switching to different pH values.

S. mutans strain O87 [O87] and its gtfBC-deficient strain [gtfBC/O87] were pre-grown in buffered pH7.5 medium and switched to the indicated pH values. The fluorescence signal reduction was calculated as the percentage of signal reduction relative to the initial signal at pH7.5. The plots show the average of triplicate samples, and the error bars correspond to the standard deviations. Student’s t-test was used to calculate the significance of the difference between the strain O87 supplemented with sucrose and that supplemented with glucose, and also between the gtfBC mutant and its parent strain. *Star indicates statistical significance between the value of indicated sample and that of strain O87 subjected to the same treatment (p < 0.05).
