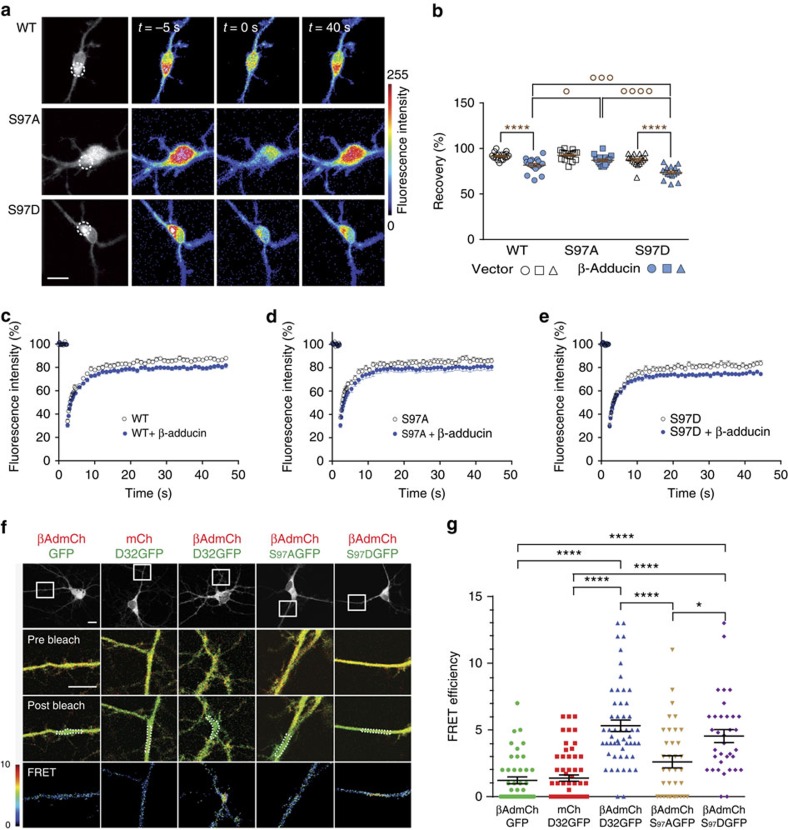
Figure 3. β-adducin alters DARPP-32 mobility and interacts with it in neurons.
(a) Mouse striatal neurons in culture were transfected with WT, S97A or S97D-DARPP-32-GFP and fluorescence monitored before and after photobleaching (photobleached area, dotted line). Scale bar, 10 μm. (b–e) GFP fluorescence was recorded in cells co-transfected with myc vector (open bars or symbols) or myc-β-adducin (blue bars or symbols). (b) Quantification of average recovery (30–60 s). Independent data points are plotted and means±s.e.m. are shown, n=14–18 per group from 3 experiments; two-way ANOVA: β-adducin factor, F(1,95)=65.47, P<10−4; Ser97 mutation factor, F(2,95)=19.82, P<10−4; interaction, F(2,95)=4.01, P=0.02. Šidák's test, presence versus absence of β-adducin, *P<0.05, ****P<10−4; effects of Ser97 mutation in the presence of β-adducin, °P<0.05; °°°°P<10−4. (c) Time course of recovery after photobleaching of WT DARPP-32-GFP (WT) fluorescence, in the absence or presence of co-transfected β-adducin. Data are means ± s.e.m. Two-way ANOVA: effect of β-adducin, F(1,1947)=198.6, P<10−4; time factor, F(58,1947)=177.2, P<10−4; no interaction, F(58,1947)=1.15. (d) Same as in c for S97A-DARPP-32-GFP. Two-way ANOVA: effect of β-adducin, F(1,1740)=91.56, P<10−4; time factor, F(59,1740)=76.94, P<10−4; no interaction, F(58,1947)=0.45. (e) Same as in c for S97D-DARPP-32-GFP. Two-way ANOVA: effect of β-adducin, F(1,1800)=135.1, P<10−4; time factor, F(59,1800)=135.0, P<10−4; no interaction, F(58,1947)=1.31. (f) For acceptor photobleaching, striatal neurons in culture were co-transfected as indicated with mCherry (mCh) or β-adducin–mCherry (βAdmCh), and GFP or GFP fused to either WT DARPP-32 (D32GFP) or S97A-DARPP-32 (S97AGFP) or S97D-DARPP-32 (S97DGFP). Top row, low-magnification single confocal sections indicating the area blown up in bottom rows (rectangles). Bottom rows, pre-bleach, post-bleach and calculated FRET images, respectively. Photobleached areas are indicated by dotted lines. FRET efficiency was calculated by measuring GFP fluorescence before and after mCherry photobleaching (pseudocolour scale indicated at bottom left). Scale bars, 10 μm. (g) Quantification of FRET efficiency as in f. Independent data points are plotted and means±s.e.m. are shown. Statistical analysis, one-way ANOVA: F(4,223)=26.97; P<0.0001. Tukey's test: *P<0.05; ****P<10−4.

