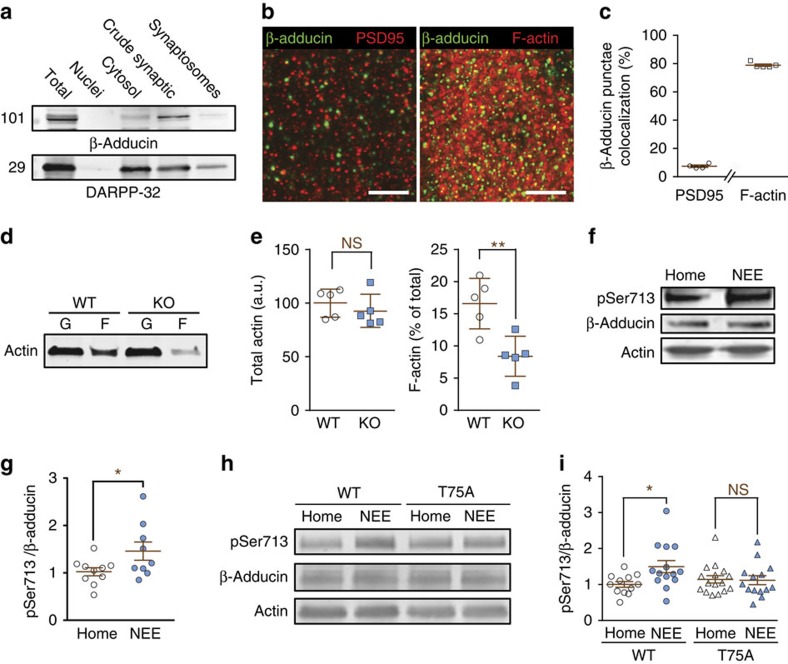
Figure 7. β-Adducin localization and phosphorylation in the striatum.
(a) Striatal homogenate were separated into major subcellular fractions by differential centrifugation and β-adducin immunoreactivity detected by immunoblotting. (b) Striatal sections were labelled with antibodies for β-adducin (green) and PSD-95 (red, left panel) or phalloidin (F-actin, red, right panel). Scale bar, 5 μm. (c) Co-localization of β-adducin and PSD-95 or F-actin was quantified and expressed as the percentage of β-adducin aggregates, which overlapped with aggregates of the other marker. n=4–5. (d) Globular (G) and filamentous (F) actin were separated in striatal homogenates from WT or β-adducin KO mice. (e) Quantification of results as in d. Total actin (=F+G in d) was normalized to the mean of WT. Statistical analysis, unpaired Student's t-test, total actin, t8=0.81, not significant (NS); F-actin, t8=3.67, **P<0.01. (f) Striatal homogenates were prepared from mice housed in their home cage or placed in a NEE for 24 h before sacrifice, and analysed by immunoblotting with antibodies for pSer713, β-adducin and actin as a loading control. (g) Quantification of results as in f, 9–10 mice per group from 2 experiments; Student's t-test, t17=2.14, *P<0.05. (h) Striatal samples were prepared from WT or T75A mutant littermate mice housed in home cage or NEE, and analysed by immunoblotting as in f. (i) Quantification of results as in h, 11–15 mice per group from >3 experiments. Two-way ANOVA: genotype factor, F(1,52)=0.90, P=0.35; housing factor, F(1,52)=3.53, P=0.06; interaction, F(1,52)=4.30, P<0.05; Šidák post hoc test, NEE versus home cage, *P<0.05. Independent data points are plotted and means±s.e.m. are shown in c,e,g,i.

