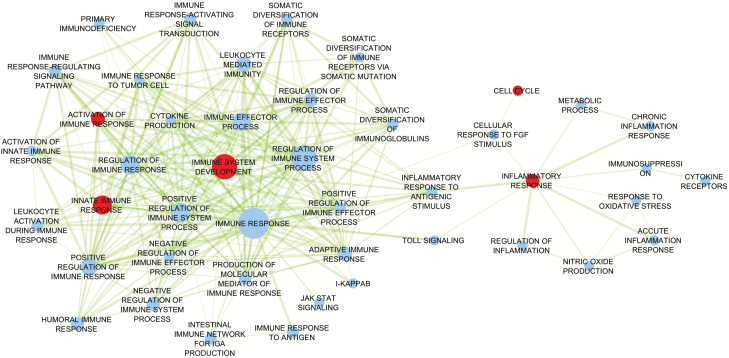
Figure 3.
Network map for inflammation pathways. Each node is a subcomponent, and the size of the node represents the number of the genes in that subcomponent. The edges are drawn if the overlapping coefficient between the two nodes is greater than 0.3. The thickness of the edges represents the degree of similarity between the two subpathway components. The red node represents the subpathway component with statistical significance level of less than .05 based on the hierarchical modeling.

