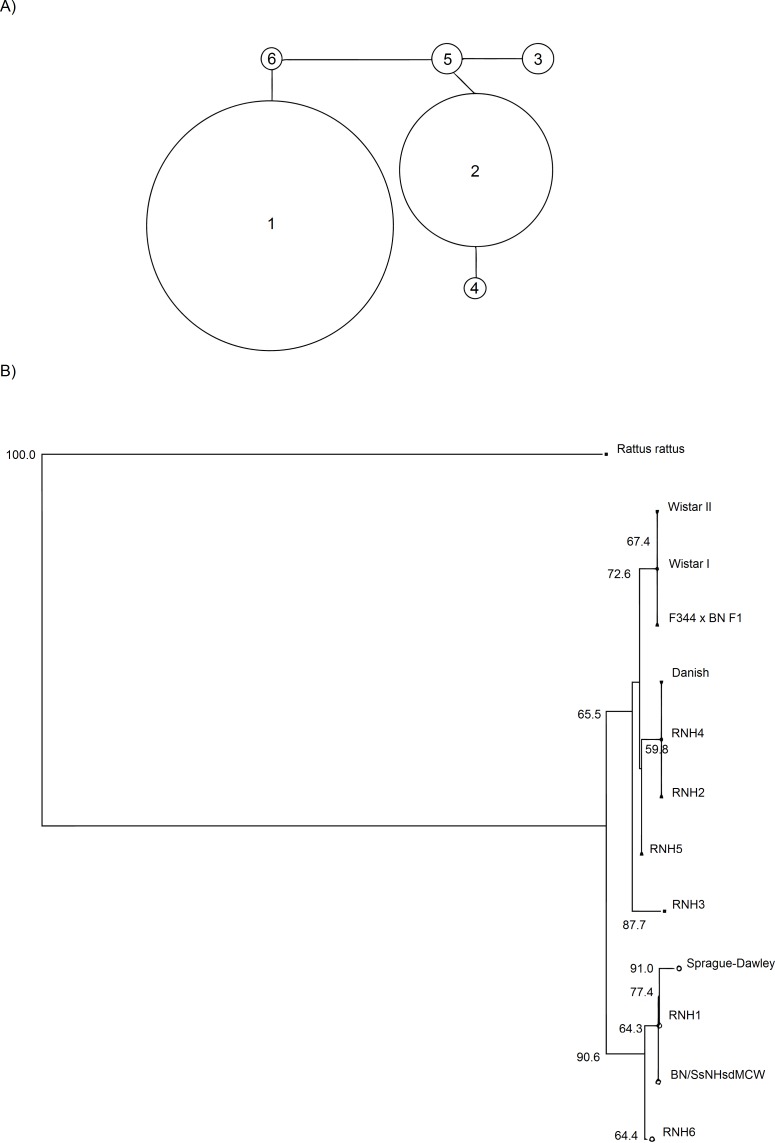
Figure 2. Phylogenetic relationships from mtDNA; study samples and closely-related Genbank sequences.
(A) Minimum spanning network of the phylogenetic relationships between the 6 mtDNA haplotypes found. The area of the circles represents the frequency of the haplotypes in the entire population. (B) Neighbour-joining tree calculated with Tamura & Nei (1993) distances for the 6 mtDNA haplotypes of English brown rats (RNH1-6), several strains of lab rats (Wistar—Accession numbers: MIRNXX, RNMITDLO, Sprague-Dawley—MIRNDNC, BN/SsNHsdMCW–AY172581, F344 X BN F1–AY769440), a Danish wild caught brown rat—RNO428514 and the closely related black rat R. rattus–DQ009794. The percentage bootstrap support (1,000 replicates) are shown for nodes with greater than 50% support.

