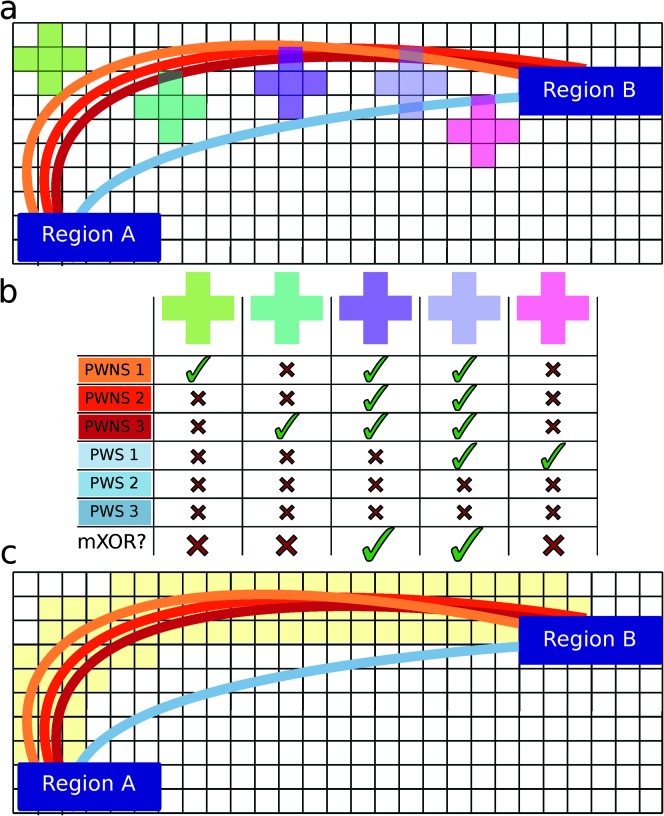
Figure 1.
Local termination pattern analysis (LTPA). Here we show an example connection in a 2-D brain (Panel a). The connection is defined by two terminal regions (Region A and Region B) and the streamlines connecting them from each individual (colored lines). Suppose there are three brains from the control group (PWNS) and three brains from the PWS group, and we want to test if there is a difference in this connection between the two groups. All three PWNS have streamlines connecting these regions, but only one of three PWS has a streamline connecting these regions. Five search spheres are constructed for illustrative purposes (colored squares). Panel b shows the result of searching in each sphere. Whether the individual has streamlines present or absent is designated by a check and an X, respectively. If the mXOR pattern is observed in that sphere, a large check is present in the bottom row. Panel c shows the result of searching over the entire connection for the mXOR pattern. All positive results are shaded in yellow.

