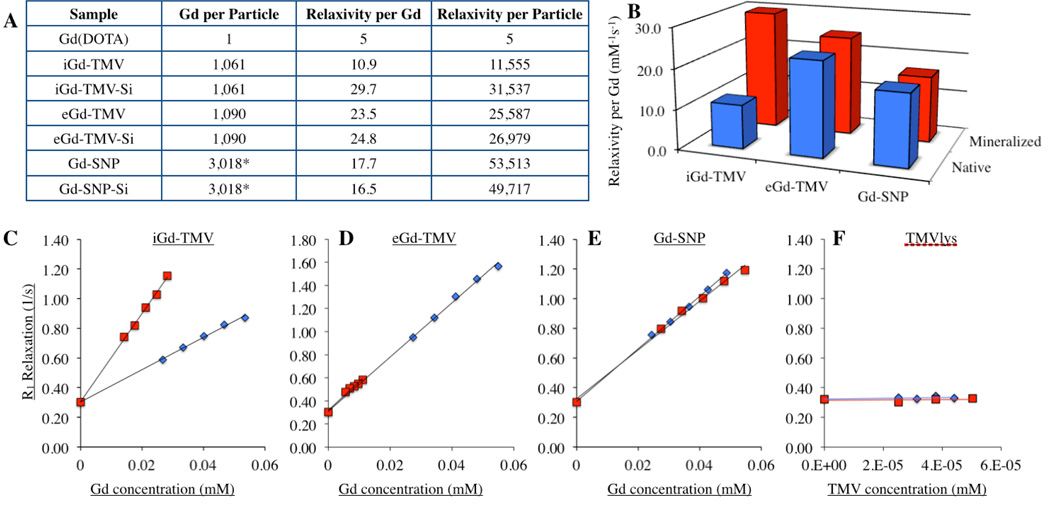
Figure 2.
(A) Table and accompanying (B) bar graph showing Gd loading per particle, relaxivity per Gd and per particle (in mM−1 s−1 at 60 MHz). The lower panels show relaxivity curves for (C) iGd-TMV, (D) eGd-TMV, (E) Gd-SNP, and (F) unmodified TMV. Blue curves are pre-mineralized (native) particles and red curves are post-mineralized particles. TMVlys shows the relaxivity curves for unlabeled TMVlys at virus concentrations matching values for iGd-TMV curves. *Gd per SNP calculated based on their size/volume relationships.

