
Figure 2.
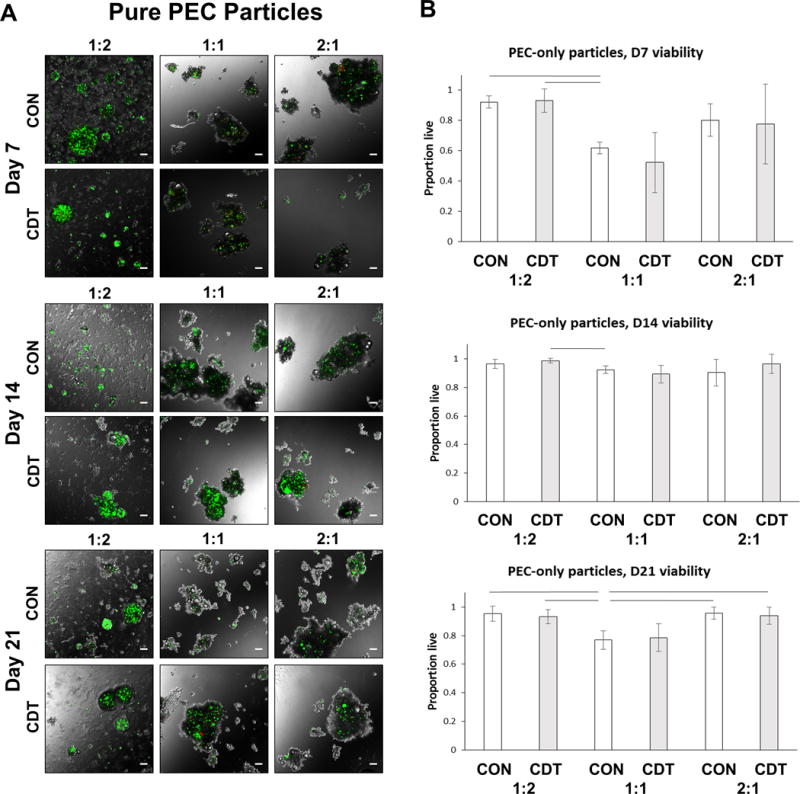
A) Overlays of fluorescence and phase contrast images of pure PEC particles containing MSC at 7, 14 and 21 days in control (CON) or chondrogenic (CDT) media. Cell-containing particles were several hundred microns in length and non-spherical. Cells retained a rounded morphology. Green=live cells, red=dead cells. Scale bar = 100 μm. B) Quantitation of MSC viability in PEC particles. Viability was greater than 75% in all groups by Day 14, but generally lower in the 1:1 CS:CH mass ratio formulation. Lines indicate p<=0.05.