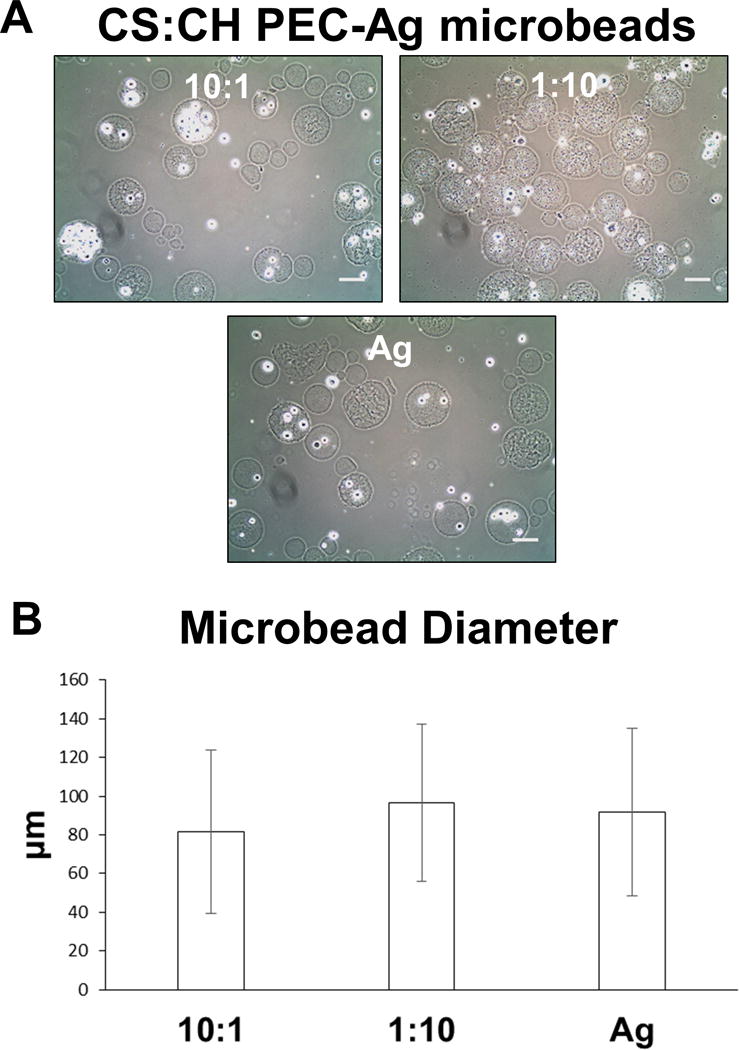
Figure 6.

A) Phase contrast images of PEC-Ag and pure Ag microbeads at day 0, showing cell and PEC incorporation. Scale bar = 100μm. B) Mean diameters microbeads made with 10:1 and 1:10 CS:CH, as well as pure agarose formulations were in the 80–100μm range and did not vary significantly with formulation.
