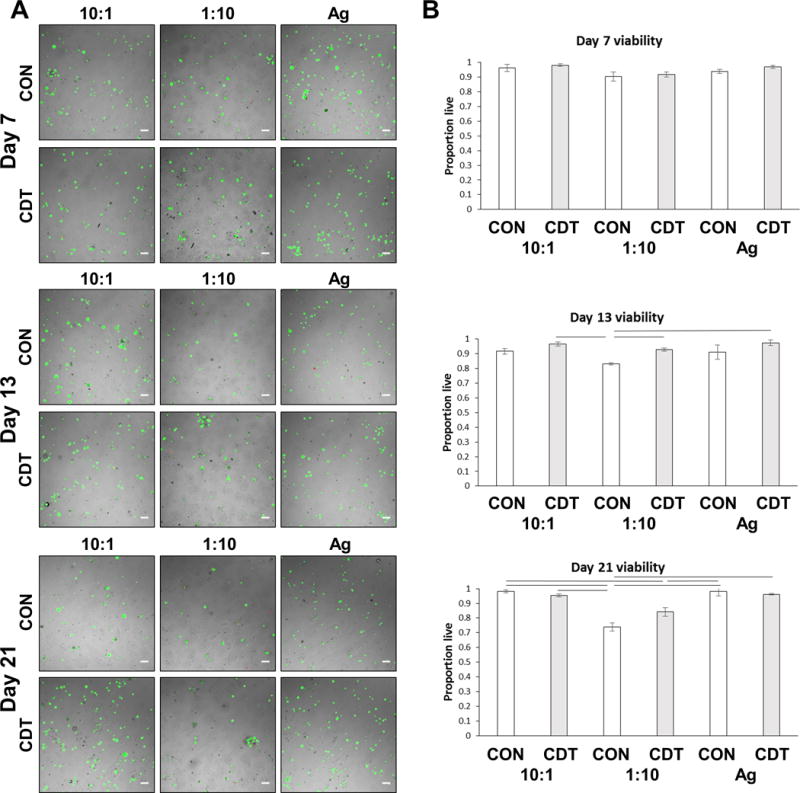
Figure 7.

A) Overlay images of fluorescence and brightfield images of PEC-Ag microbeads containing MSC at 7, 13 and 21 days in control (CON) or chondrogenic (CDT) media. Cells under both conditions retained a rounded morphology, displaying little to no spreading over the time course. Green=live cells, red=dead cells. Scale bar = 100 μm. B) Quantitation of MSC viability in PEC-Ag microbeads shows the proportion of live cells in the 10:1 and Ag-only microbeads exceeded 90% at all time point. Lines indicate p<=0.05.
