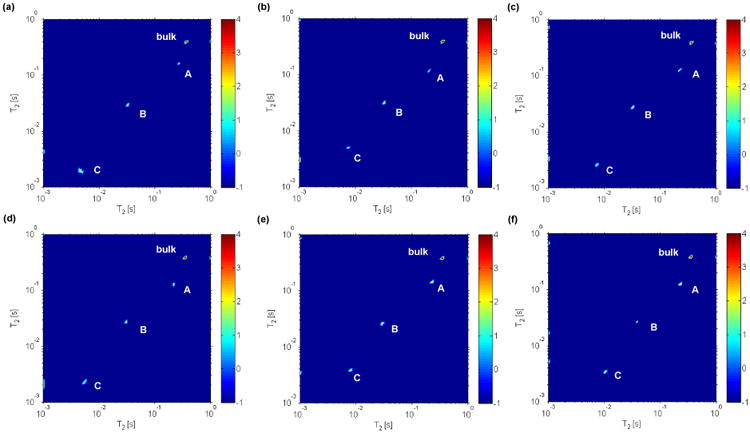
Figure 2.

2D ILT map of 2H T2 – T2 exchange experiments performed on untreated intact bone at 22 °C. In the experiments the mixing time tm (supplementary figure S1) was experimentally varied as follows (a) 100 μs, (b) 500 μs, (c) 1 ms, (d) 2 ms, (e) 3 ms and (f) 10 ms. No cross peaks are observed over the times probed which would indicate slow or little exchange between different sites. In this figure the color bar to the right, denoting signal intensity in arbitrary units, is on a logarithmic scale.
