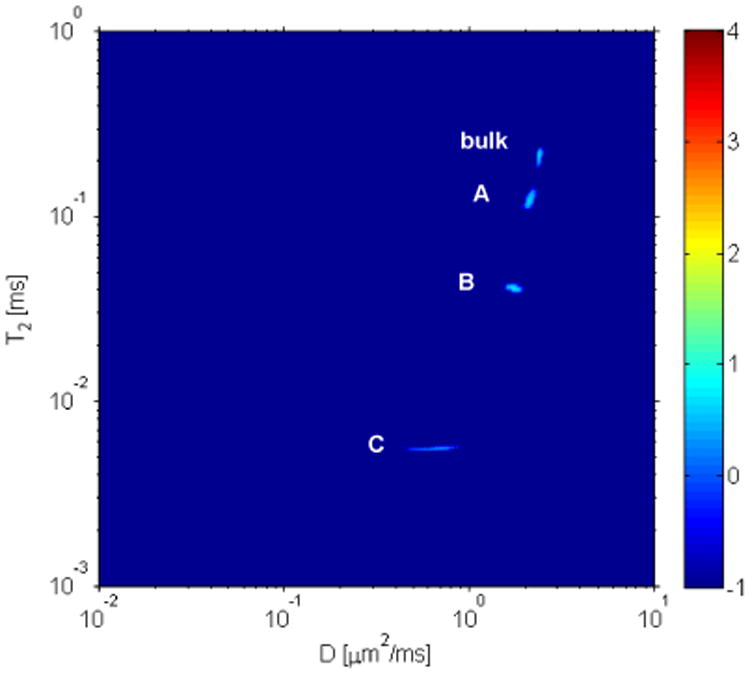
Figure 4.

2D diffusion-T2 correlation map of fractured bone soaked in D2O for 30 days. As discussed in the text, four distinguishable components of water were observed. Note that the measured T2 values are slightly different than that in the T1 – T2 and T2 – T2 as the Larmor field was slightly different. The measured diffusion coefficients are tabulated in table 2. In this figure the color bar to the right, denoting signal intensity in arbitrary units, is on a logarithmic scale.
