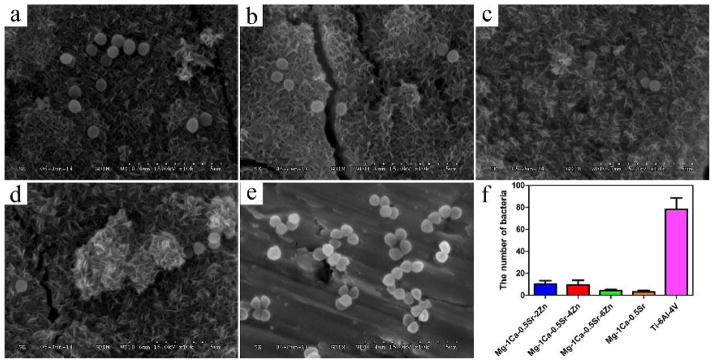
Figure 15.
SEM images of different alloys after exposure to S. aureus suspension for 4 h: a) g-1Ca-0.5Sr-2Zn, b) Mg-1Ca-0.5Sr-4Zn, c) Mg-1Ca-0.5Sr-6Zn, d) Mg-1Ca-0.5Sr, e) Ti-6Al-4V, f) the number of bacteria attached on the alloys surface. The error bars represent the standard deviations calculated from five independent experiments

