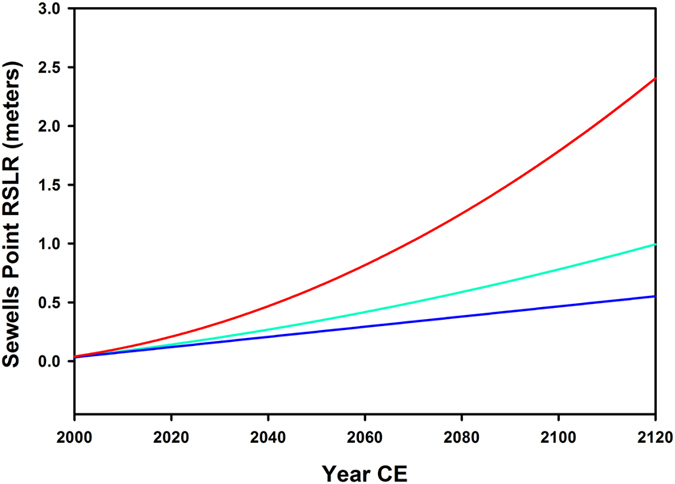
Figure 2. Local RSLR over time at Sewell’s Point, Virginia, used in all analyses.

Blue line is the low- RSLR scenario, teal line is the mid-RSLR scenario, and red is the high-RSLR scenario.

Blue line is the low- RSLR scenario, teal line is the mid-RSLR scenario, and red is the high-RSLR scenario.