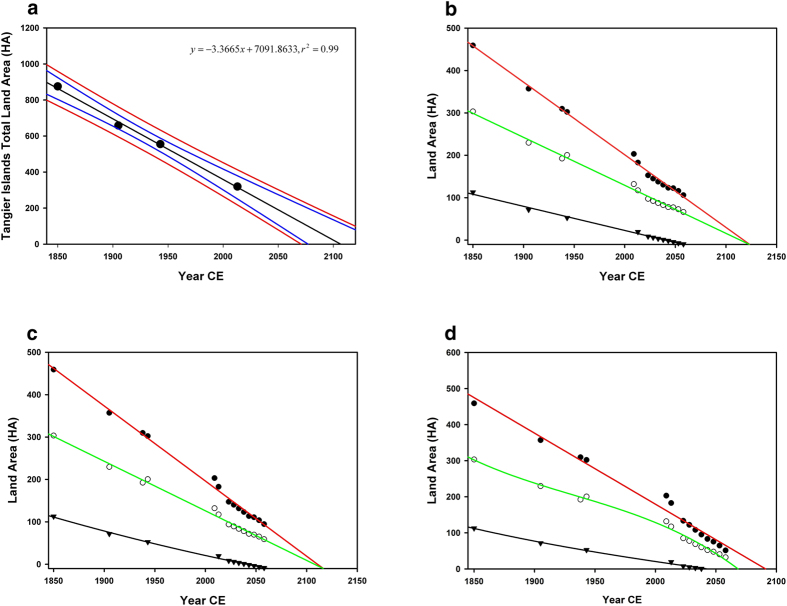
Figure 4. Regressions on the total Tangier Islands landmass over time.
(Panel a) considers the total Islands landmass with the historic rate of RSLR applied, blue lines are prediction bands, red lines are the 95% CI. Remaining graphs consider the three main Islands separately (Goose = triangles, Uppards = open circles, Tangier = filled circles). (Panel b) considers the low-range RSLR scenario, panel c considers the mid-range RSLR scenario, and panel d considers the high-range RSLR scenario.

