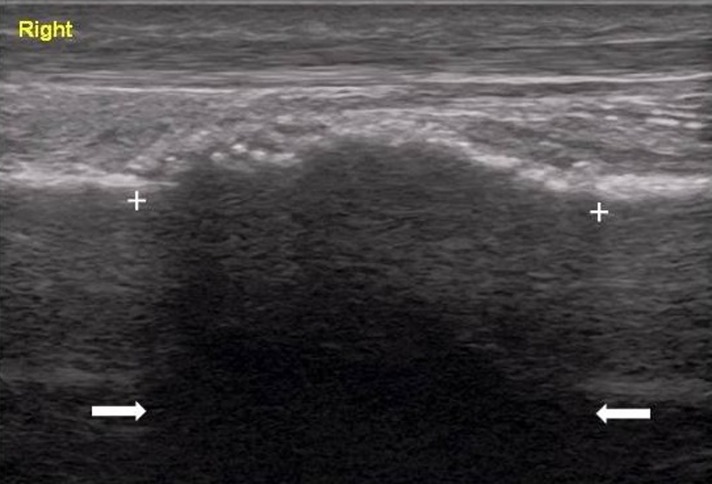
Figure 3.
Longitudinal ultrasound image of the right distal fibula, taken 53 days following symptom onset. Ultrasound settings: B mode, 10 MHz, depth 3.5 cm, image width 3.84 cm. Fibular bone callus evident as a 2.30 cm long area of cortical irregularity with a mixed hypoechoic‐hyperechoic appearance (between the white crosses). Posterior acoustic shadowing from the bone callus visible (between the white arrows).

