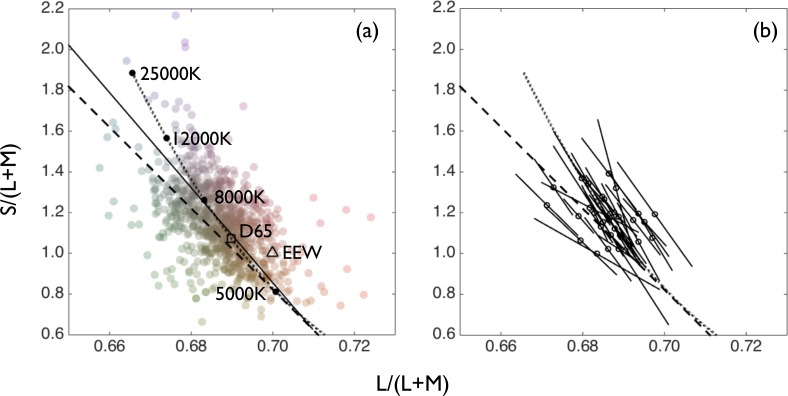
Figure 1.
Settings of absolute white from all participants. (a) Each data point represents one setting for one participant. The dashed line is the cerulean line. The dotted line is the locus of CIE daylights. The continuous black line is the orthogonal linear regression through the data. The locations of equal-energy white (EEW), D65, and CIE daylights of particular (labeled) color temperatures are marked. Two outlying data points of S/(L+M) > 2.2 do not appear on this plot. (b) For each participant, the mean white setting is indicated by a circle and the axis of maximum variability by a continuous black line. The line subtends one standard deviation on either side of the mean.

