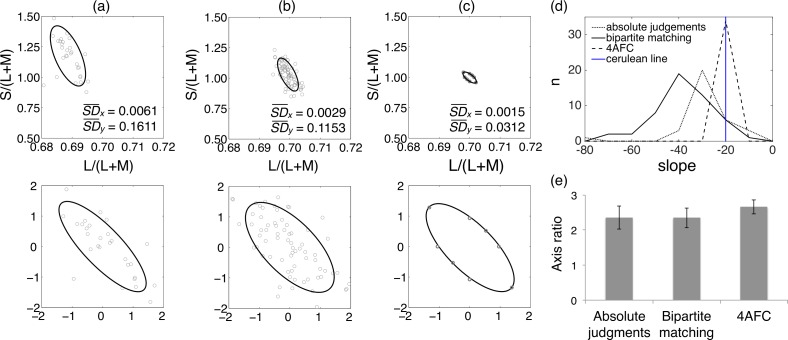
Figure 2.
Results of Experiment 2. (a–c) Example data from a single participant for each of the three tasks. The standard deviations of the L/(L+M) (x) and the S/(L+M) (y) data points are provided on each plot. (a, left) Judgments of absolute white made in Experiment 1. (b, left center) Bipartite matches. (c, right center) Four-alternative forced-choice color discrimination. In each case, data are shown in the MacLeod-Boynton chromaticity diagram in the upper panel. For absolute judgments and for bipartite matching, the fitted ellipses are standard deviation ellipses. For four-alternative forced choice, they are fit through the eight data points measured. In each case, the fitting is done in a version of the MacLeod-Boynton chromaticity diagram that is transformed so that variability along the x and y axes is equal. The ellipses are transformed back for plotting in the original spaces. The lower panels show the data and fitted ellipses in the transformed MacLeod-Boynton chromaticity diagrams. (d, top right) Distributions of the slopes of the major axes of the ellipses. The slope of the cerulean lines is shown for comparison. (e, bottom right) Comparison of axis ratios for Experiments 1 and 2. The axis ratios are not significantly different between the three conditions.

