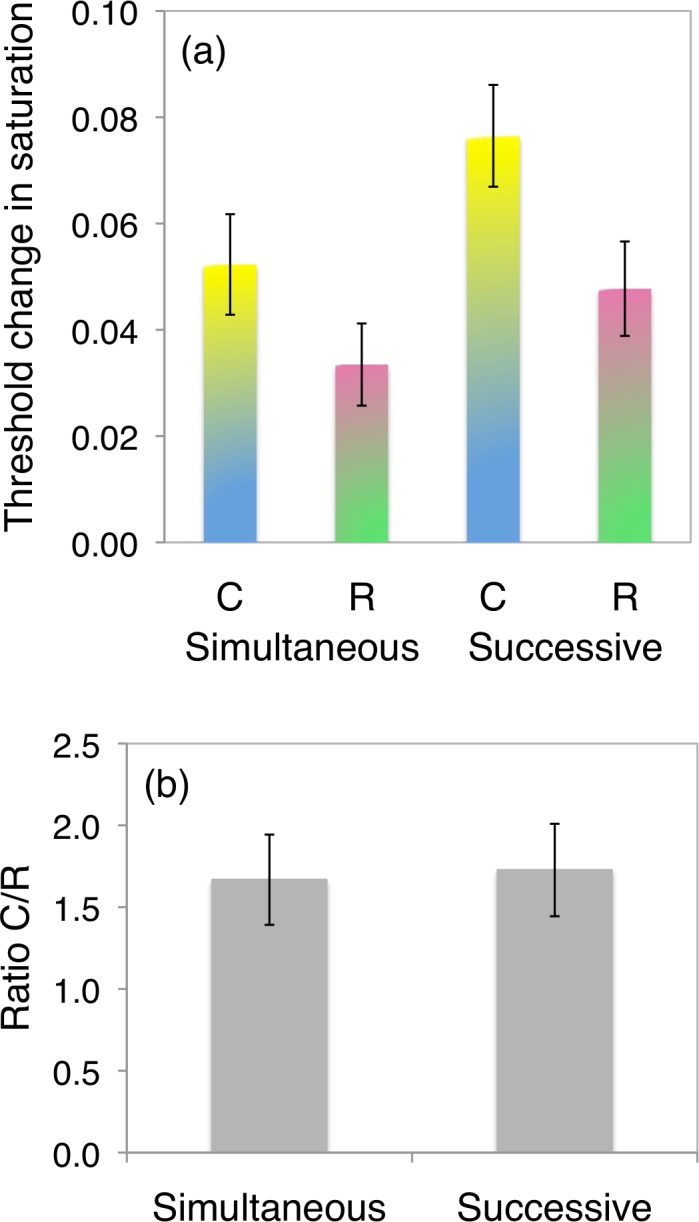
Figure 3.

Results of Experiment 3. (a) Average threshold for detection of a change in saturation in our two conditions, successive discrimination and simultaneous discrimination. The saturation scale s can be converted to our MacLeod-Boynton coordinates by S/(L+M) = s*cos(d) and L/(L+M) = 0.0623s*sin(d), where d = 141 or 321 for the cerulean line and d = 39 or 219 for the reflection. In both simultaneous and successive conditions, thresholds are significantly higher along the cerulean line (C) than along the reflection of the cerulean line (R). However, when the ratio of thresholds along the cerulean line to thresholds along the reflection is taken, there is no significant difference between conditions (b).
