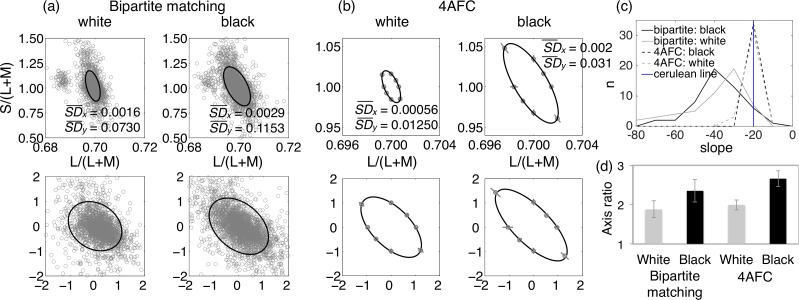
Figure 4.
Results of Experiment 4. (a) Standard deviation ellipses fit to data combined from all participants for the bipartite matching task. The left panels show matches on the white surround, and the right panels show matches on the black surround. In the upper panels, the data are shown in the MacLeod-Boynton chromaticity diagram, and in the lower panels, they are shown in our transformed space. (b) Discrimination ellipses averaged across all participants for the four-alternative forced-choice task. The four subplots are equivalent to those in (a). Error bars indicate 95% confidence intervals. On the upper plots of (a) and (b), the standard deviations of the L/(L+M) (x) and the S/(L+M) (y) data points are provided. (c) Distributions of the slopes of the major axes of the ellipses for all subjects in all conditions. The slope of the cerulean line is shown for comparison. (d) Axis ratios for all conditions. For both bipartite matching and for four-alternative forced choice, axis ratios are significantly greater for the black surround than for the white surround. Error bars indicate 95% confidence intervals.

