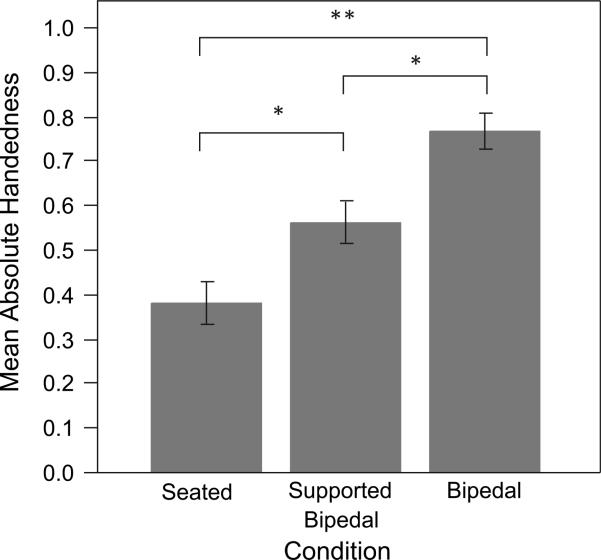
Fig. 3.
Mean absolute value of HI with error bars indicating mean standard error. The changes in mean absolute value of HI between the baseline and the supported condition was significant (*p < 0.02), as was that between the supported condition and the unsupported condition (*p < 0.01), and between the baseline and the unsupported bipedal posture (**p < 0.001).

